Chargers vs Jacksonville Jaguars Match Player Stats
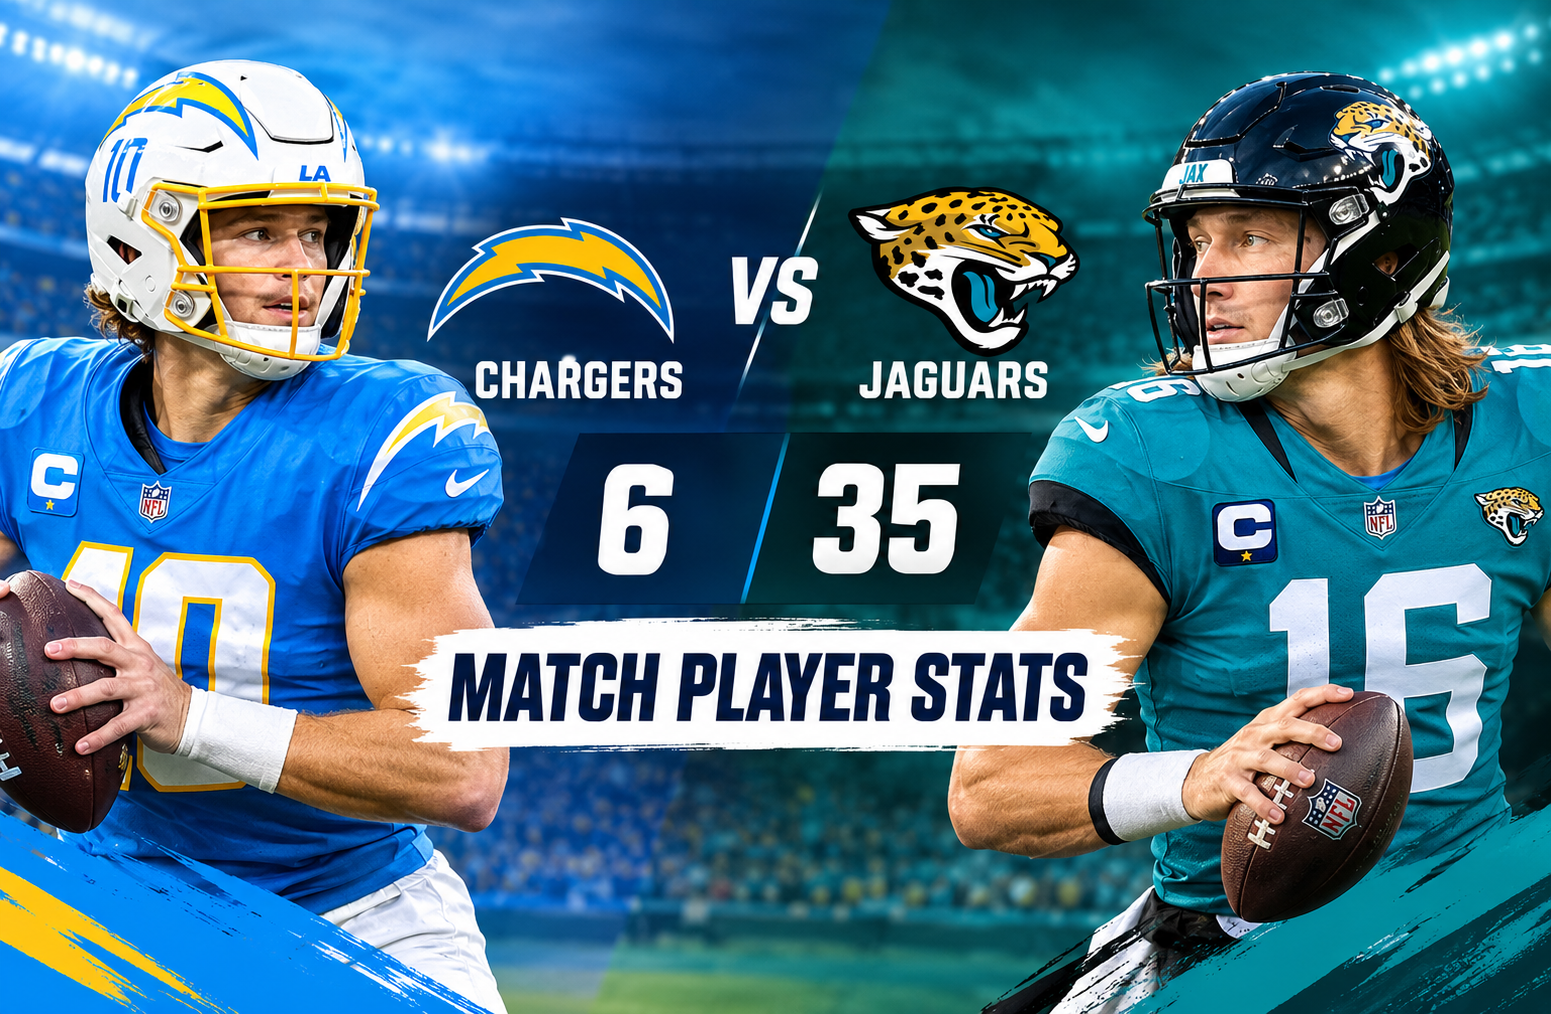
The chargers vs jacksonville jaguars match player stats from November 16, 2025, reveal a dominant Jacksonville performance that exposed the Los Angeles Chargers’ offensive struggles. The Jaguars secured a convincing 35-6 victory, scoring in every quarter while holding the Chargers scoreless in the second half. Jacksonville combined an effective ground attack, timely passing, and disruptive defense to control the game from start to finish.
The final score tells only part of the story. Jacksonville rushed for 192 yards and four touchdowns, while Los Angeles managed just 42 rushing yards and 93 passing yards as a team. The Jaguars also recorded three sacks and intercepted a pass, creating problems that the Chargers could not overcome.
This breakdown examines the quarterback numbers, rushing and receiving performances, defensive contributions, kicking statistics, and team-level differences that shaped the result. All game figures below are based on the supplied ESPN box-score data for November 16, 2025.
Game Overview: Jacksonville Jaguars vs Los Angeles Chargers
The matchup took place with Jacksonville hosting Los Angeles. The Jaguars delivered their strongest advantage on the ground, maintaining a consistent rushing threat and turning scoring opportunities into touchdowns.
Jacksonville Jaguars
Home team
35 points
Winner
Los Angeles Chargers
Away team
6 points
Game date
November 16, 2025
Final margin
Jaguars by 29
Jaguars rushing
192 yards
Chargers passing
93 yards
Source: ESPN NFL box score supplied for this game.
Quarter-by-Quarter Scoring
| Quarter | Chargers | Jaguars |
| First | 3 | 7 |
| Second | 3 | 7 |
| Third | 0 | 7 |
| Fourth | 0 | 14 |
| Total | 6 | 35 |
Jacksonville scored seven points in each of the first three quarters before adding 14 in the fourth. Los Angeles scored a field goal in each of the first two quarters but failed to add any points after halftime.
That progression matters because the game was not simply decided by one explosive opening drive. Jacksonville continued to produce points as the game developed, while the Chargers’ offense lost its ability to respond.
Chargers vs Jacksonville Jaguars Match Player Stats
The most revealing figures from this contest are the differences in rushing production, passing efficiency, and defensive pressure. Jacksonville did not need a huge passing performance to build a 29-point winning margin. Its running backs carried the offensive workload, and its defense helped prevent Los Angeles from establishing a comeback.
Team Statistics Comparison
| Statistical category | Chargers | Jaguars |
| Final score | 6 | 35 |
| Passing completions | 13 | 14 |
| Passing attempts | 26 | 22 |
| Passing yards | 93 | 153 |
| Passing touchdowns | 0 | 1 |
| Interceptions thrown | 1 | 1 |
| Rushing attempts | 16 | 47 |
| Rushing yards | 42 | 192 |
| Rushing touchdowns | 0 | 4 |
| Yards per rushing attempt | 2.6 | 4.1 |
| Receptions | 13 | 14 |
| Receiving yards | 118 | 153 |
| Receiving touchdowns | 0 | 1 |
| Sacks recorded by defense | 0 | 3 |
| Tackles for loss | 2 | 5 |
| Passes defended | 3 | 7 |
| Quarterback hits | 2 | 6 |
| Field goals made | 2 | 0 |
| Extra points made | 0 | 5 |
Note: Passing and receiving yards are separate statistical categories and should not be added together as if they were independent team yardage totals. The supplied team receiving total also differs from the Chargers’ passing total, so the figures are reproduced as listed in the provided box-score data.
Three findings stand out:
- Jacksonville controlled the ground game: The Jaguars gained 150 more rushing yards than Los Angeles.
- The Chargers lacked scoring efficiency: Their 93 passing yards and 42 rushing yards produced no offensive touchdowns.
- The Jaguars applied more defensive pressure: Jacksonville recorded three sacks and six quarterback hits, compared with zero sacks and two quarterback hits for the Chargers.
These numbers explain why Jacksonville could win comfortably without relying on a high-volume passing attack.
Justin Herbert Player Stats: A Difficult Day for the Chargers Quarterback
Justin Herbert entered the matchup as Los Angeles’ passing leader, but the supplied figures show how difficult it was for him to generate consistent offensive production.
Justin Herbert’s Passing Performance
| Statistic | Result |
| Completions | 10 |
| Attempts | 18 |
| Completion percentage | 55.6% |
| Passing yards | 81 |
| Yards per attempt | 4.5 |
| Passing touchdowns | 0 |
| Interceptions | 1 |
| Sacks taken | 2 |
| Sack yardage | 18 |
| Passer rating | 44.0 |
| ESPN QBR | 22.0 |
Herbert completed 10 of his 18 passes for 81 yards. His 4.5 yards per attempt indicates that Los Angeles struggled to gain meaningful distance through the air.
A completion percentage of 55.6% is not enough by itself to explain the loss. Quarterbacks can win with modest completion rates when they generate explosive plays, convert third downs, and finish drives. The problem here was the combination of limited yardage, no passing touchdowns, an interception, and sacks.
Why Herbert’s Passing Numbers Matter
Herbert averaged only 4.5 yards per attempt. That figure suggests that Los Angeles was not consistently stretching the field or creating enough yardage on completed passes.
The two sacks also cost the Chargers 18 yards. Sacks affect more than the official passing total: they can push an offense out of manageable down-and-distance situations and make subsequent plays harder to convert.
His interception added another obstacle. When an offense already has trouble moving the ball, losing possession can remove one of its limited opportunities to score.
It would be inaccurate to blame the defeat entirely on Herbert. Football outcomes depend on protection, play design, receivers getting open, rushing support, and defense. However, the quarterback statistics clearly show that Los Angeles did not get the passing production it needed.
Trey Lance’s Contribution
Trey Lance also attempted passes for the Chargers.
| Statistic | Trey Lance |
| Completions | 3 |
| Attempts | 8 |
| Completion percentage | 37.5% |
| Passing yards | 37 |
| Yards per attempt | 4.6 |
| Passing touchdowns | 0 |
| Interceptions | 0 |
| Sacks taken | 1 |
| Sack yardage | 7 |
| Passer rating | 52.6 |
| ESPN QBR | 2.4 |
Lance completed three of eight attempts for 37 yards without a touchdown or interception. His 4.6 yards per attempt was slightly higher than Herbert’s figure, but that small difference should not be interpreted as evidence that the passing offense improved substantially.
Lance also took a seven-yard sack. The sample was limited, and the supplied statistics do not provide enough context to assess the circumstances of each attempt or the full sequence of his playing time.
The broader conclusion remains straightforward: neither Chargers quarterback produced a passing touchdown, and the offense finished with just 93 team passing yards.
Trevor Lawrence Player Stats: Efficient Enough to Support the Run
Trevor Lawrence’s performance was not statistically spectacular in terms of total passing yards, but it fit Jacksonville’s offensive approach.
Trevor Lawrence Passing Stats
| Statistic | Result |
| Completions | 14 |
| Attempts | 22 |
| Completion percentage | 63.6% |
| Passing yards | 153 |
| Yards per attempt | 7.0 |
| Passing touchdowns | 1 |
| Interceptions | 1 |
| Sacks taken | 0 |
| Passer rating | 80.3 |
| ESPN QBR | 60.8 |
Lawrence completed 63.6% of his passes and averaged 7.0 yards per attempt. He threw for 153 yards and one touchdown, although he also threw an interception.
The most important distinction between Lawrence and Herbert was not simply their passing-yard totals. Lawrence’s passing game operated alongside a rushing attack that gained 192 yards and scored four touchdowns. Jacksonville did not need its quarterback to carry the entire offense.
How Lawrence Supported Jacksonville’s Game Plan
Lawrence’s 7.0 yards per attempt exceeded Herbert’s 4.5. That difference gave Jacksonville more passing production per attempt, while the threat of the run helped keep its offense balanced.
His 14 completions also matched Jacksonville’s listed total of 14 team receptions. The Jaguars converted those completions into 153 receiving yards, averaging 10.9 yards per catch.
Lawrence’s interception is an important qualification. Jacksonville did not play a turnover-free game, and the quarterback’s numbers should not be presented as flawless. The team’s overall performance was strong because it generated production in other areas, particularly on the ground and on defense.
Quarterback Comparison
| Measure | Justin Herbert | Trevor Lawrence |
| Completions | 10 | 14 |
| Attempts | 18 | 22 |
| Completion rate | 55.6% | 63.6% |
| Passing yards | 81 | 153 |
| Yards per attempt | 4.5 | 7.0 |
| Passing touchdowns | 0 | 1 |
| Interceptions | 1 | 1 |
| Sacks taken | 2 | 0 |
| Passer rating | 44.0 | 80.3 |
Lawrence led in completion rate, passing yards, yards per attempt, and passing touchdowns. Both quarterbacks threw one interception, but Lawrence avoided sacks in the supplied box-score data.
That comparison helps explain the difference between the teams, although Jacksonville’s rushing advantage was an even larger part of the result.
Jacksonville Jaguars Rushing Stats: The Foundation of the Victory
Jacksonville’s rushing attack was the defining feature of the game. The team recorded 47 carries for 192 yards and four rushing touchdowns. Los Angeles finished with 16 carries for 42 yards and no rushing touchdowns.
That is a 150-yard difference on the ground, a major advantage over four quarters.
Bhayshul Tuten’s Rushing Performance
| Statistic | Result |
| Carries | 15 |
| Rushing yards | 74 |
| Yards per carry | 4.9 |
| Rushing touchdowns | 1 |
| Longest run | 15 yards |
Bhayshul Tuten led Jacksonville in rushing yards with 74 on 15 attempts. His 4.9-yard average was the highest among the Jaguars’ principal ball carriers listed in the supplied data.
Tuten’s output gave Jacksonville a dependable source of yardage without requiring an unusually high number of carries. His longest run of 15 yards also shows that he produced at least one meaningful gain capable of moving the offense forward quickly.
His touchdown added direct scoring value to his yardage total.
Travis Etienne Jr. Delivers Two Touchdowns
| Statistic | Result |
| Carries | 19 |
| Rushing yards | 73 |
| Yards per carry | 3.8 |
| Rushing touchdowns | 2 |
| Longest run | 13 yards |
Travis Etienne Jr. recorded 73 rushing yards on 19 carries and scored twice.
Although Etienne averaged fewer yards per carry than Tuten, his two touchdowns made his contribution especially important. Touchdowns are a separate measure of production from yardage: a player can average fewer yards per attempt yet have a larger direct impact on the scoreboard.
Etienne’s 19 carries also gave Jacksonville a consistent option for moving the ball on the ground. When a team can distribute carries between multiple productive backs, it can sustain its running game without relying on a single player for every important possession.
LeQuint Allen Jr. Adds Valuable Yardage
LeQuint Allen Jr. finished with eight carries for 36 yards, averaging 4.5 yards per carry. His longest run covered 12 yards.
Allen did not score a rushing touchdown, but he helped Jacksonville maintain its ground production beyond its two leading rushers. His contribution is a reminder that a successful running game depends on the combined work of the backfield rather than only the player with the most carries.
Trevor Lawrence’s Rushing Contribution
Lawrence added five carries for nine yards and one rushing touchdown, according to the supplied figures.
His average of 1.8 yards per carry was modest, but the touchdown still mattered. Quarterback rushing can give an offense another way to finish a scoring opportunity, particularly near the goal line.
The supplied team rushing total includes 47 carries, 192 yards, and four touchdowns. Those totals are the most useful summary of Jacksonville’s overall success on the ground.
Jacksonville Rushing Leaders
| Player | Carries | Yards | Average | TDs |
| Bhayshul Tuten | 15 | 74 | 4.9 | 1 |
| Travis Etienne Jr. | 19 | 73 | 3.8 | 2 |
| LeQuint Allen Jr. | 8 | 36 | 4.5 | 0 |
| Trevor Lawrence | 5 | 9 | 1.8 | 1 |
| Team total | 47 | 192 | 4.1 | 4 |
These figures show both volume and scoring efficiency. Etienne supplied the highest number of carries, Tuten produced the most rushing yards, and Lawrence added a rushing touchdown of his own.
The four rushing touchdowns were central to Jacksonville’s 35-point total.
Los Angeles Chargers Rushing Stats: Limited Ground Production
Los Angeles recorded 42 rushing yards on 16 attempts, averaging 2.6 yards per carry. The Chargers did not score a rushing touchdown, leaving the offense without a ground-based scoring threat in this matchup.
Justin Herbert Leads the Chargers in Rushing
Herbert was the Chargers’ leading rusher with three carries for 21 yards, averaging 7.0 yards per attempt. His longest run covered 12 yards.
Those numbers look positive in isolation. However, they also highlight an offensive imbalance: the quarterback produced more rushing yards than any other listed Chargers player, yet the team finished with only 42 total rushing yards.
Herbert’s individual average should not be confused with the team’s average. His 7.0 yards per carry came from just three attempts, while the full team average was 2.6 across 16 carries.
Kimani Vidal and the Supporting Runners
| Player | Carries | Yards | Average | Longest run |
| Justin Herbert | 3 | 21 | 7.0 | 12 |
| Kimani Vidal | 5 | 13 | 2.6 | 4 |
| Amar Johnson | 2 | 8 | 4.0 | 6 |
| Trey Lance | 3 | 1 | 0.3 | 1 |
| Trayveon Williams | 3 | -1 | -0.3 | 2 |
| Team total | 16 | 42 | 2.6 | 12 |
Kimani Vidal recorded 13 yards on five carries. Amar Johnson added eight yards on two attempts, while Lance contributed one rushing yard. Trayveon Williams finished with minus-one yard on three carries.
The individual results point to a lack of consistent ground production. Herbert’s 21 yards provided a useful contribution, but the remaining runners did not collectively create enough yardage to keep Jacksonville’s defense from focusing on the passing game.
Why the Rushing Gap Was So Important
Jacksonville gained 4.1 yards per carry, compared with 2.6 for Los Angeles. Across the teams’ respective workloads, that difference helped Jacksonville sustain drives and create scoring chances.
The Jaguars also attempted nearly three times as many rushes as the Chargers. That volume allowed Jacksonville to make its ground game a central part of the offensive plan.
For Los Angeles, the lack of rushing production made it more difficult to establish balance. When a team cannot gain dependable yardage on early downs, its passing offense may face more difficult situations. The Chargers’ low passing total and Jacksonville’s defensive pressure compounded the problem.
Receiving Stats: Keenan Allen and Jakobi Meyers Lead Their Teams
The receiving statistics offer another way to understand the offensive difference. Keenan Allen led the Chargers with 53 receiving yards, while Jakobi Meyers led Jacksonville with 64.
The Jaguars recorded 153 team receiving yards, compared with 118 listed for Los Angeles. Jacksonville also recorded one receiving touchdown, while the Chargers had none.
Keenan Allen’s Chargers Receiving Stats
| Statistic | Result |
| Receptions | 4 |
| Targets | 6 |
| Receiving yards | 53 |
| Yards per reception | 13.3 |
| Touchdowns | 0 |
| Longest reception | 30 yards |
Allen was the Chargers’ most productive receiver by yardage. His four catches produced 53 yards, and his longest reception covered 30 yards.
He averaged 13.3 yards per reception, showing that his catches generated meaningful distance. However, his output did not translate into a touchdown, and Los Angeles struggled to build on the production of its leading receiver.
Allen’s six targets also indicate that he was a regular option in the passing game. Even so, the team did not produce enough successful passing plays overall to challenge Jacksonville’s growing lead.
Oronde Gadsden Provides a Secondary Receiving Threat
Oronde Gadsden recorded two catches for 41 yards on five targets. His 20.5 yards per reception was the highest average among the Chargers receivers listed with multiple catches.
His longest reception covered 28 yards, making him an important source of the team’s limited explosive passing production.
Gadsden’s statistics show why individual receiving averages need context. He produced more than 20 yards per catch, but he had only two receptions. That is useful evidence of his contribution, not proof that the Chargers’ passing attack was effective as a whole.
Ladd McConkey’s Numbers
Ladd McConkey caught three passes for 13 yards on four targets. His longest reception was seven yards, and he averaged 4.3 yards per catch.
McConkey’s reception total was close to Allen’s, but the yardage difference was substantial. His figures suggest that his completed receptions generated shorter gains during this game.
A receiver’s impact cannot be fully measured through yardage alone, because blocking, route execution, and defensive attention also matter. The supplied statistics, however, show that McConkey did not produce the same downfield gains as Allen or Gadsden.
Other Chargers Receiving Contributions
| Player | Receptions | Targets | Yards | Touchdowns |
| Tre’ Harris | 1 | 1 | 12 | 0 |
| Trayveon Williams | 1 | 1 | 0 | 0 |
| Kimani Vidal | 1 | 2 | -1 | 0 |
| Derius Davis | 0 | 1 | 0 | 0 |
| Quentin Johnston | 0 | 1 | 0 | 0 |
| Amar Johnson | 0 | 3 | 0 | 0 |
Tre’ Harris caught his only target for 12 yards. Williams recorded one catch without gaining a receiving yard, while Vidal’s reception resulted in minus-one yard.
Derius Davis and Quentin Johnston did not record a catch in the supplied data. Amar Johnson also finished without a reception despite receiving three targets.
The team totals listed for Los Angeles were 13 receptions, 118 receiving yards, and 24 targets, with no receiving touchdowns. Those numbers illustrate how difficult it was for the Chargers to turn opportunities into sustained offensive production.
Jakobi Meyers Leads Jacksonville’s Receivers
| Statistic | Result |
| Receptions | 5 |
| Targets | 6 |
| Receiving yards | 64 |
| Yards per reception | 12.8 |
| Touchdowns | 0 |
| Longest reception | 21 yards |
Meyers led the Jaguars in receiving yards and catches. He secured five of six targets for 64 yards, averaging 12.8 yards per reception.
His five receptions gave Lawrence a reliable option in the passing game. Although Meyers did not score, his production helped Jacksonville complement its powerful rushing attack with efficient passing plays.
Meyers’ longest catch was 21 yards. While that was shorter than Allen’s longest reception, his overall yardage was higher, demonstrating the value of consistent involvement across multiple plays.
Tim Patrick Records a Receiving Touchdown
Tim Patrick caught three passes for 20 yards and one touchdown. His average was 6.7 yards per reception, and his longest catch covered 10 yards.
Patrick’s touchdown was especially important because it added a passing score to an offense that had already established its ground game. Jacksonville could threaten the defense with running plays and still convert a passing opportunity into points.
This balance prevented the Jaguars from depending entirely on rushing touchdowns.
Other Jaguars Receiving Stats
| Player | Receptions | Targets | Yards | Touchdowns |
| Johnny Mundt | 2 | 3 | 25 | 0 |
| Parker Washington | 2 | 2 | 20 | 0 |
| Austin Trammell | 1 | 1 | 13 | 0 |
| Quintin Morris | 1 | 1 | 11 | 0 |
| Travis Etienne Jr. | 0 | 3 | 0 | 0 |
| Dyami Brown | 0 | 2 | 0 | 0 |
Mundt added 25 yards on two catches, while Washington recorded two receptions for 20 yards. Trammell and Morris each caught one pass for more than 10 yards.
Etienne and Brown did not record a reception in the supplied data. Etienne, however, made a much larger contribution as a runner, scoring twice on the ground.
The Jaguars finished with 14 receptions for 153 yards and one receiving touchdown on 22 targets. Their passing attack did not need to dominate the game because the running game handled much of the scoring responsibility.
Defensive Player Stats: Jacksonville Controls the Line of Scrimmage
The defensive figures help explain why Los Angeles could not mount a comeback. Jacksonville recorded three sacks, five tackles for loss, seven passes defended, and six quarterback hits.
The Chargers recorded no sacks, two tackles for loss, three passes defended, and two quarterback hits.
Team Defensive Comparison
| Defensive statistic | Chargers | Jaguars |
| Total tackles | 76 | 52 |
| Solo tackles | 43 | 24 |
| Sacks | 0 | 3 |
| Tackles for loss | 2 | 5 |
| Passes defended | 3 | 7 |
| Quarterback hits | 2 | 6 |
| Defensive touchdowns | 0 | 0 |
Los Angeles recorded more total tackles, but that does not automatically mean its defense performed better. A team that spends more time defending may accumulate more tackles simply because it faces more plays.
Jacksonville’s defensive production was more disruptive in the categories that directly affected the passing game. The Jaguars recorded three sacks and six quarterback hits, limiting the Chargers’ ability to operate comfortably.
Their seven passes defended also show that Jacksonville disrupted more passing attempts at the point of reception or interception opportunity.
Josh Hines-Allen’s Defensive Contribution
Josh Hines-Allen recorded four total tackles, two solo tackles, one sack, one tackle for loss, one pass defended, and one quarterback hit.
His sack was part of Jacksonville’s three-sack team performance. The tackle for loss added another negative play for the Chargers, while the quarterback hit demonstrated additional pressure beyond the recorded sack.
Defensive pressure can affect an offense even when it does not result in a sack. It can force an earlier throw, reduce the time available to read the field, or interfere with a developing play. The box score establishes Hines-Allen’s recorded production, though it does not by itself identify every pressure he generated.
Foyesade Oluokun’s Defensive Numbers
Foyesade Oluokun finished with five total tackles, three solo tackles, and two passes defended.
His two passes defended were notable within a Jaguars defense that recorded seven overall. Those plays contributed to a broader defensive performance that made passing more difficult for Los Angeles.
Oluokun’s statistics also illustrate that defensive influence comes in different forms. Tackles stop or limit ball carriers, while passes defended can prevent completions and force offenses to look elsewhere.
Chargers Defensive Standouts
Elijah Molden led the Chargers’ listed defensive contributors with seven total tackles and five solo tackles. Denzel Perryman also recorded seven total tackles, including four solo tackles.
Both players contributed to the team’s tackle count, but the Chargers defense did not record a sack in the supplied data.
The distinction is important: tackle volume alone cannot tell the full story of a defensive performance. The Chargers recorded 76 total tackles, yet Jacksonville scored 35 points. The Jaguars’ offensive efficiency and ability to sustain rushing production placed continued pressure on the defense.
Turnovers and Ball Security
The supplied statistics list one interception for each team and no recorded fumbles for either side.
| Turnover statistic | Chargers | Jaguars |
| Interceptions thrown | 1 | 1 |
| Interceptions recorded by defense | 1 | 1 |
| Fumbles listed | 0 | 0 |
Antonio Johnson recorded an interception for Jacksonville and returned it 44 yards without scoring a defensive touchdown. Donte Jackson recorded the Chargers’ interception, with no return yards or touchdown listed.
Antonio Johnson’s Interception
Johnson’s interception was one of Jacksonville’s key defensive plays. The 44-yard return gave the Jaguars a substantial return-yardage contribution, although the supplied figures do not establish the exact starting field position or the points that followed directly from the play.
An interception can change field position and momentum, but its full impact depends on what the offense does afterward. It is therefore best to treat Johnson’s return as an important defensive contribution rather than automatically attributing a particular scoring drive to it.
Donte Jackson’s Interception
Donte Jackson recorded the Chargers’ interception. That play showed that Los Angeles also generated a takeaway, despite the final score.
The turnover balance was even at one interception apiece, so the result cannot be explained simply by saying that Jacksonville won the interception battle. The larger differences came from rushing production, quarterback pressure, and scoring efficiency.
Neither team had a fumble recorded in the supplied data. That removes fumbles as a documented factor in this statistical comparison, though it does not mean every possession was equally effective.
Special Teams Stats: Field Goals, Extra Points, and Returns
Special teams provided a small but measurable part of the scoring difference. Cameron Dicker made both of his field-goal attempts for Los Angeles, while Cam Little converted all five extra-point attempts for Jacksonville.
Kicking Statistics
| Statistic | Cameron Dicker | Cam Little |
| Field goals made | 2 | 0 |
| Field-goal attempts | 2 | 0 |
| Field-goal percentage | 100% | Not applicable |
| Longest field goal | 46 yards | Not applicable |
| Extra points made | 0 | 5 |
| Total points | 6 | 5 |
Dicker accounted for all six Chargers points, making field goals from the opportunities represented in the supplied statistics. His longest successful kick was 46 yards.
Little did not attempt a field goal in the listed data, but he converted five extra points. Jacksonville’s touchdowns therefore generated additional points through successful extra-point attempts.
The difference illustrates an important part of football scoring. Field goals can keep a team on the scoreboard, but touchdowns produce more points and usually reflect a more successful finish to an offensive possession. Los Angeles made two field goals but failed to score a touchdown, while Jacksonville combined rushing and receiving touchdowns with successful extra points.
Punting Statistics
JK Scott recorded four punts for 195 yards, averaging 48.8 yards per punt. His longest punt was 57 yards, and two punts landed inside the 20-yard line. No touchbacks were recorded in the supplied figures.
Jacksonville did not record a punt.
The absence of a Jaguars punt is consistent with an offense that produced 35 points and maintained strong rushing production. It is a notable team statistic, although the box-score data alone does not establish every detail of the possession sequence.
Kick Return Statistics
| Team and player | Returns | Return yards | Average | Longest |
| Derius Davis, Chargers | 4 | 101 | 25.3 | 27 |
| Trayveon Williams, Chargers | 1 | 22 | 22.0 | 22 |
| Chargers total | 5 | 123 | 24.6 | 27 |
| LeQuint Allen Jr., Jaguars | 2 | 55 | 27.5 | 32 |
Davis handled most of the Chargers’ listed kick returns, gaining 101 yards on four attempts. Williams added 22 yards on one return.
For Jacksonville, Allen averaged 27.5 yards on two returns, with a longest return of 32 yards.
These figures show that both teams generated return yardage. However, return averages do not necessarily translate into scoring opportunities, and neither team recorded a kick-return touchdown in the supplied statistics. No punt returns were recorded for either side.
What Decided the Game? Five Statistical Takeaways
The box score reveals several connected reasons for Jacksonville’s 35-6 victory.
1. Jacksonville Dominated the Ground Game
The 192-42 rushing-yard difference was the most obvious statistical gap. Jacksonville gained 150 more yards on the ground, averaged 4.1 yards per carry, and scored four rushing touchdowns.
Los Angeles averaged 2.6 yards per carry and failed to score a rushing touchdown. That contrast gave Jacksonville a dependable offensive foundation while leaving the Chargers with fewer ways to sustain drives.
2. The Jaguars Finished Drives With Touchdowns
Jacksonville scored five touchdowns according to the supplied team passing and rushing figures: four rushing touchdowns and one receiving touchdown. Los Angeles recorded no offensive touchdowns.
The Chargers made two field goals, but those six points were not enough to keep pace with Jacksonville’s scoring. The difference between field goals and touchdowns was central to the final margin.
3. Lawrence Was More Efficient as a Passer
Lawrence averaged 7.0 yards per attempt, compared with Herbert’s 4.5. He also completed 63.6% of his passes, while Herbert completed 55.6%.
Both quarterbacks threw an interception, but Lawrence recorded a passing touchdown and took no sacks in the supplied data. Herbert threw no touchdown passes and was sacked twice for 18 yards.
4. Jacksonville Generated More Defensive Pressure
The Jaguars recorded three sacks and six quarterback hits. The Chargers recorded no sacks and two quarterback hits.
That difference suggests Jacksonville was more successful at disrupting the opposing quarterback. Pressure can limit the time available to make decisions and make passing plays harder to complete, particularly when an offense is already struggling to gain yardage.
5. The Chargers Could Not Sustain Second-Half Scoring
Los Angeles scored three points in each of the first two quarters and zero in both the third and fourth. Jacksonville scored seven in each of the first three quarters before adding 14 in the final period.
The second-half shutout is an important part of the story. The Chargers needed to generate points to reduce the deficit, but the offense did not score after halftime.
How to Interpret the Match Player Statistics Correctly
For readers comparing NFL player performances, a box score is most useful when individual figures are evaluated alongside team results.
A few principles help avoid misleading conclusions.
- Separate volume from efficiency. A running back with 19 carries has more opportunities to accumulate yards than a player with eight carries. Yards per carry helps provide context.
- Evaluate quarterbacks beyond completion percentage. Passing yards per attempt, touchdowns, interceptions, sacks, and the overall team result provide a fuller picture.
- Consider scoring production. A player who scores two touchdowns may have a major impact even if another player gains slightly more total yardage.
- Distinguish defensive activity from defensive effectiveness. Total tackles can be high because a defense faces many plays. Sacks, tackles for loss, interceptions, and passes defended help describe disruption.
- Use the game situation as context. A team trailing by a large margin may approach the fourth quarter differently from a team protecting a lead.
These principles are useful beyond this single matchup. They help readers understand whether a player’s production was efficient, whether it contributed to scoring, and how individual numbers fit the wider game.
Source and Statistical Accuracy
The figures in this article are based on the supplied ESPN box-score data for the November 16, 2025, game. Readers seeking the original game record can consult the ESPN Chargers vs Jaguars box score.
One distinction is worth keeping in mind: the supplied dataset lists team receiving totals that do not fully reconcile with the passing totals, particularly for the Chargers. The article preserves the provided figures rather than silently changing them or presenting an unsupported explanation. When precise statistical reconciliation is required, the official game record should take precedence over derived totals.
Frequently Asked Questions
1. What was the final score of the Chargers vs Jacksonville Jaguars game on November 16, 2025?
The Jacksonville Jaguars defeated the Los Angeles Chargers 35-6. Jacksonville scored in all four quarters, while Los Angeles failed to score in the second half.
2. Who was the leading rusher in the game?
Bhayshul Tuten led all listed players in rushing yards with 74 yards on 15 carries. Travis Etienne Jr. recorded 73 rushing yards and two touchdowns, while Tuten added one rushing touchdown.
3. How many passing yards did Justin Herbert record?
Justin Herbert completed 10 of 18 passes for 81 yards, with no passing touchdowns and one interception. He also took two sacks for a combined loss of 18 yards.
4. How did Trevor Lawrence perform against the Chargers?
Trevor Lawrence completed 14 of 22 passes for 153 yards, one touchdown, and one interception. He averaged 7.0 yards per attempt and was not sacked in the supplied statistics. He also recorded a rushing touchdown.
5. Which team had the better rushing performance?
Jacksonville had the stronger rushing performance, finishing with 192 yards and four touchdowns on 47 carries. Los Angeles recorded 42 yards and no touchdowns on 16 carries.
6. Which defensive player recorded an interception?
Antonio Johnson intercepted a pass for Jacksonville and returned it 44 yards. Donte Jackson recorded an interception for the Chargers, with no return yards listed.
Conclusion
The Chargers vs Jacksonville Jaguars match player stats show a convincing Jacksonville victory built on rushing production, efficient passing, and defensive pressure. The Jaguars won 35-6 after gaining 192 rushing yards, scoring four rushing touchdowns, and recording three sacks. Their balanced offensive approach allowed Trevor Lawrence to contribute without requiring a high-volume passing performance.
For Los Angeles, Justin Herbert finished with 81 passing yards, one interception, and no passing touchdowns. The Chargers’ 42 rushing yards and lack of offensive touchdowns made it difficult to keep pace with Jacksonville. Keenan Allen provided a team-high 53 receiving yards, but the offense could not turn its limited production into touchdowns.
The most important statistical difference was Jacksonville’s ability to turn offensive opportunities into points. Tuten and Etienne led the rushing attack, Lawrence contributed through the air and on the ground, and the defense disrupted the Chargers’ passing game. Together, those performances explain the 29-point margin more clearly than any single player statistic.