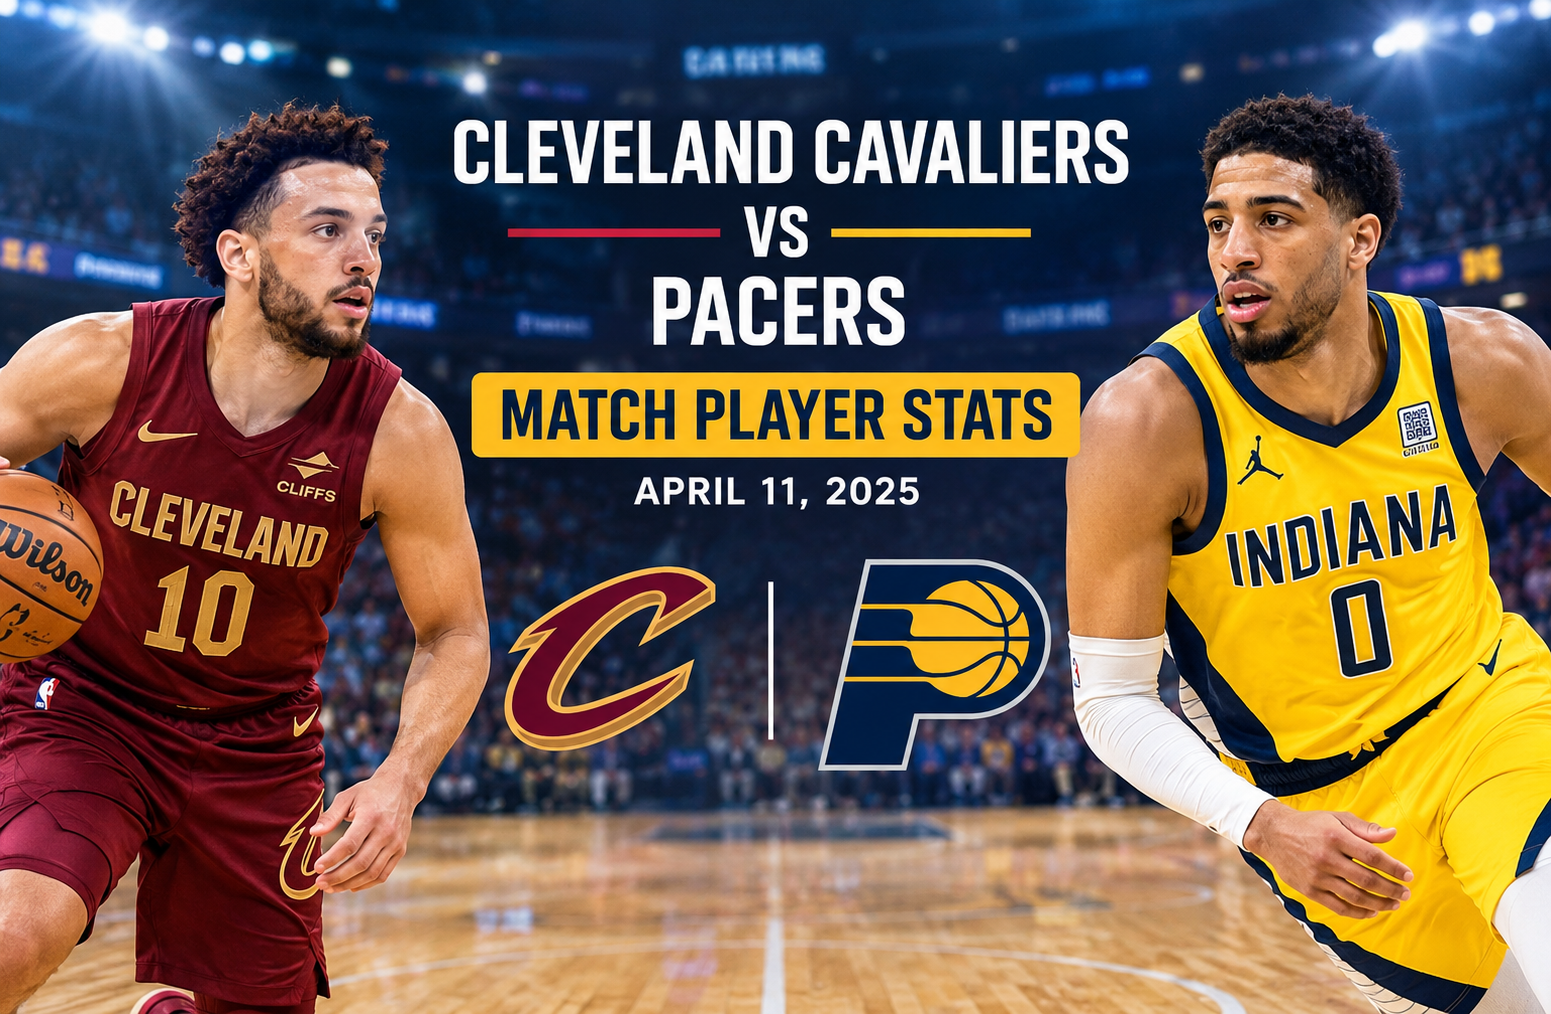
Cleveland Cavaliers vs Pacers Match Player Stats
The Cleveland Cavaliers vs Pacers match player stats from April 11, 2025, tell the story of a closely contested NBA game decided by just two points. The Indiana Pacers defeated the Cleveland Cavaliers 114-112 at Gainbridge Fieldhouse in Indianapolis. Tyrese Haliburton led Indiana with 23 points and 10 assists, while Ty Jerome scored 24 points for Cleveland. De’Andre Hunter added 23 points and 11 rebounds, giving the Cavaliers another strong individual performance. Despite Cleveland’s 17 three-pointers and 50 total rebounds, Indiana secured the win through balanced scoring, 28 assists, and 11 blocked shots. The final box score reveals how both teams performed offensively, defensively, and across individual player matchups.
Cleveland Cavaliers vs Pacers Match Player Stats: Game Overview
The April 11 meeting featured two teams with strong regular-season records. Cleveland entered the game at 63-17 overall, while Indiana held a 49-31 record. The Cavaliers had already established themselves as one of the leading teams in the Eastern Conference, but the Pacers defended their home court in a narrow finish.
FINAL SCORE · APRIL 11, 2025
Cleveland Cavaliers
Away team · 63-17 entering game
112
Indiana Pacers
Home team · 49-31 entering game
114
Venue
Gainbridge Fieldhouse
Attendance
17,020
Competition
NBA regular season
Winning margin
Indiana by 2
Quarter-by-quarter scoring
| Quarter | Cleveland Cavaliers | Indiana Pacers |
| First quarter | 23 | 28 |
| Second quarter | 33 | 24 |
| Third quarter | 26 | 29 |
| Fourth quarter | 30 | 33 |
| Final score | 112 | 114 |
Indiana opened with a five-point advantage in the first quarter. Cleveland responded with a 33-point second quarter and took control of the scoring during that period.
The third quarter shifted the momentum back toward Indiana, which outscored Cleveland by three points. The Pacers then added 33 points in the fourth quarter, compared with Cleveland’s 30.
The quarter totals show that Indiana built its early lead, absorbed Cleveland’s second-quarter response, and finished with enough scoring to protect a narrow advantage. Cleveland scored more points in the second and fourth quarters combined than Indiana did in those periods, but Indiana’s stronger first and third quarters helped establish the final result.
Complete Cleveland Cavaliers Player Stats
Cleveland had several productive individual performances. Ty Jerome led the team with 24 points, while De’Andre Hunter contributed 23 points and 11 rebounds. Craig Porter Jr. and Jaylon Tyson were also listed among the team’s key scorers in the supplied game summary, although the detailed player entries contain a discrepancy that needs attention.
The table below follows the individual player lines supplied with the box-score data.
| Player | Points | Rebounds | Assists | Steals | Blocks |
| Ty Jerome | 24 | 2 | 6 | 0 | 1 |
| De’Andre Hunter | 23 | 11 | 2 | 2 | 1 |
| Craig Porter Jr. | 16 | 3 | 3 | 0 | 0 |
| Sam Merrill | 15 | 3 | 4 | 1 | 1 |
| Isaac Okoro | 13 | 2 | 2 | 0 | 0 |
| Dean Wade | 8 | 4 | 4 | 2 | 0 |
| Tristan Thompson | 7 | 12 | 0 | 0 | 0 |
| Jarrett Allen | 3 | 10 | 1 | 0 | 0 |
| Javonte Green | 3 | 2 | 2 | 1 | 0 |
| Jaylon Tyson | 0* | 1 | 0* | 0* | 0* |
*The supplied player summary lists Jaylon Tyson among the key scorers with 16 points, but the detailed player line lists 0 points and 1 rebound. The detailed entry is reproduced here as provided, and this discrepancy should be checked against the original ESPN box score before publication.
Ty Jerome’s scoring performance
Ty Jerome finished with 24 points, six assists, two rebounds, and one block according to the supplied player line. His scoring output was the highest among Cleveland’s listed individual performances.
Jerome’s combination of scoring and playmaking gave Cleveland a productive offensive option. Six assists indicate that he contributed beyond his own shot attempts by helping teammates create scoring opportunities.
In a game decided by two points, a 24-point performance is significant. However, individual scoring totals alone do not establish whether a player was efficient. Field-goal attempts, turnovers, minutes played, and shot selection would provide a fuller picture of Jerome’s contribution.
De’Andre Hunter’s all-around contribution
Hunter recorded 23 points, 11 rebounds, two assists, two steals, and one block. His double-double made him one of Cleveland’s most complete performers in this matchup.
His 11 rebounds were particularly valuable because the Cavaliers finished with 50 total rebounds as a team. Rebounding helps a team end defensive possessions and create additional offensive opportunities.
Hunter also recorded two steals and a block. Those defensive plays show that his contribution extended beyond scoring and rebounding. His listed plus/minus of +18 was the highest among the Cavaliers’ players in the supplied data.
Plus/minus measures the difference between a team’s points scored and points allowed while a particular player is on the court. It does not independently prove that a player caused the team’s performance, but it offers additional context alongside traditional statistics.
Sam Merrill and Isaac Okoro provide scoring support
Sam Merrill contributed 15 points, three rebounds, four assists, one steal, and one block. His four assists matched Dean Wade’s total and helped Cleveland distribute the ball.
Isaac Okoro added 13 points, two rebounds, and two assists. His scoring gave Cleveland another contributor beyond Jerome and Hunter.
Cleveland’s ability to obtain points from several players helped the team reach 112 points. Nevertheless, scoring depth did not produce a victory in this game. The final result also depended on defensive stops, shot selection, and Indiana’s ability to generate scoring opportunities late in the contest.
Cleveland’s frontcourt and bench contributions
Tristan Thompson recorded 7 points and 12 rebounds, while Jarrett Allen finished with 3 points and 10 rebounds. Together, their listed totals show that Cleveland received substantial rebounding contributions from its interior players.
Dean Wade added eight points, four rebounds, four assists, and two steals. Javonte Green finished with three points, two rebounds, two assists, and one steal.
Craig Porter Jr. was listed with 16 points, three rebounds, and three assists. Because the supplied key-scorer summary instead attributes 16 points to Jaylon Tyson, the original box score should be consulted to verify the individual scoring entries before treating the table as a definitive record.
Complete Indiana Pacers Player Stats
Indiana received important contributions from Tyrese Haliburton, Aaron Nesmith, Jarace Walker, Myles Turner, and Bennedict Mathurin. Haliburton led the team in both scoring and assists, recording 23 points and 10 assists.
The Pacers’ player statistics also highlight their defensive contribution. Turner recorded four blocks, while Haliburton added three. These performances helped Indiana finish with 11 blocks as a team.
| Player | Points | Rebounds | Assists | Steals | Blocks |
| Tyrese Haliburton | 23 | 8 | 10 | 0 | 3 |
| Aaron Nesmith | 22 | 6 | 1 | 0 | 0 |
| Jarace Walker | 15 | 3 | 0* | 0* | 0* |
| Myles Turner | 13 | 7 | 1 | 0 | 4 |
| Bennedict Mathurin | 13 | 3 | 1 | 1 | 0 |
| Obi Toppin | 10 | 4 | 2 | 0 | 2 |
| T.J. McConnell | 6 | 3 | 4 | 0 | 1 |
| Pascal Siakam | 10 | 8 | 2 | 0 | 1 |
| Andrew Nembhard | 2 | 1 | 7 | 2 | 0 |
| Thomas Bryant | 0 | 3 | 0* | 0* | 0* |
*The supplied data does not include complete individual assist, steal, and block figures for every player. Unlisted values are not independently verified and should not be interpreted as confirmed official totals.
Tyrese Haliburton leads Indiana’s offense
Haliburton recorded 23 points, eight rebounds, and 10 assists. He also registered three blocks, according to the supplied player statistics.
His 10 assists were especially important because they reflected Indiana’s ability to create opportunities for multiple scorers. The Pacers finished with 28 assists, four more than Cleveland’s 24.
Haliburton’s contribution went beyond putting points on the board. His passing helped connect the offense, while his rebounding added value on both ends of the court. His three blocks also stand out for a guard, although the full defensive impact of those plays would require film or play-by-play review.
His listed plus/minus was +15, the highest among Indiana’s players in the supplied data. That figure indicates that the Pacers outscored Cleveland by 15 points during his time on the floor. It should be considered alongside his individual production rather than treated as a standalone measure of performance.
Aaron Nesmith delivers 22 points
Aaron Nesmith scored 22 points and collected six rebounds. He was Indiana’s second-highest scorer in the supplied player data.
Nesmith’s scoring helped reduce the pressure on Haliburton to generate every offensive possession. When a team has multiple players capable of producing points, defenders have more offensive threats to account for.
His six rebounds also added to Indiana’s overall work on the glass. The Pacers finished with 46 rebounds, four fewer than Cleveland, but they still secured the win.
Nesmith’s output is a useful reminder that a winning performance does not always require one player to dominate every statistical category. Indiana spread its scoring across several contributors.
Myles Turner protects the paint
Turner recorded 13 points, seven rebounds, one assist, and four blocks. His four blocks were the highest individual total listed for either team.
Blocks can change the course of a possession by preventing a shot from reaching the basket. They can also make opponents reconsider driving into the paint, even when a defensive possession does not end with a recorded block.
Indiana finished with 11 blocks, compared with Cleveland’s three. That eight-block difference was one of the clearest statistical contrasts between the teams.
Turner’s defensive production was particularly notable because Cleveland recorded 50 rebounds and shot 46% from three-point range. Indiana did not dominate every aspect of the game, but its rim protection helped compensate for the Cavaliers’ perimeter shooting.
Jarace Walker and Bennedict Mathurin add scoring depth
Jarace Walker scored 15 points and made three three-pointers, according to the supplied summary. His outside shooting provided another source of offense for Indiana.
Bennedict Mathurin added 13 points, three rebounds, one assist, and one steal. Myles Turner also scored 13 points, meaning Indiana had several players contributing double-digit scoring.
This distribution made it more difficult for Cleveland to focus exclusively on Haliburton. When several players can score, defensive coverage must account for different shooting and driving threats.
Walker and Mathurin’s contributions also show why a close game should not be assessed solely by comparing the two leading scorers. The supporting cast can be decisive when the final margin is only two points.
Pascal Siakam contributes across multiple categories
Siakam finished with 10 points, eight rebounds, two assists, two turnovers, and one block. Although his scoring total was lower than those of Haliburton and Nesmith, his rebounding helped Indiana maintain a presence around the basket.
His eight rebounds tied Haliburton for Indiana’s highest individual total in the supplied data.
Siakam’s contribution illustrates the value of evaluating players through several categories. Points show scoring output, rebounds indicate work on the glass, assists reflect playmaking, and turnovers show lost possessions.
No single statistic provides a complete assessment of a player’s performance. The combination gives readers a more balanced view of each player’s role.
Cleveland Cavaliers vs Indiana Pacers: Team Statistics Comparison
The team statistics reveal several important differences between the sides. Cleveland shot better from three-point range and collected more rebounds. Indiana, however, recorded more assists, fewer turnovers, and significantly more blocks.
| Statistical category | Cleveland Cavaliers | Indiana Pacers |
| Final score | 112 | 114 |
| Field goals made | 43 | 43 |
| Field-goal attempts | 98 | 93 |
| Field-goal percentage | 44% | 46% |
| Three-pointers made | 17 | 14 |
| Three-point attempts | 37 | 41 |
| Three-point percentage | 46% | 34% |
| Free throws made | 9 | 14 |
| Free-throw attempts | 13 | 20 |
| Free-throw percentage | 69% | 70% |
| Total rebounds | 50 | 46 |
| Offensive rebounds | 11 | 10 |
| Defensive rebounds | 39 | 36 |
| Assists | 24 | 28 |
| Turnovers | 11 | 9 |
| Steals | 6 | 3 |
| Blocks | 3 | 11 |
| Team fouls | 16 | 16 |
Percentages are reproduced from the supplied game data and rounded to whole numbers.
Field-goal efficiency
Cleveland made 43 of 98 field-goal attempts, while Indiana made 43 of 93. Both teams made the same number of shots from the field, but Indiana attempted five fewer.
This difference contributed to Indiana’s higher field-goal percentage. The Pacers finished at 46%, compared with Cleveland’s 44%.
A higher field-goal percentage does not automatically determine the winner. The value of each shot, free throws, turnovers, and offensive rebounds all influence the final score.
In this game, Indiana’s ability to convert a similar number of field goals from fewer attempts helped it remain competitive despite Cleveland’s strong three-point shooting.
Three-point shooting
Cleveland made 17 of 37 three-point attempts, producing a listed percentage of 46%. Indiana made 14 of 41 attempts, with a listed percentage of 34%.
Cleveland therefore made three more three-pointers than Indiana. Because each successful three-pointer is worth three points, that difference represented nine points of scoring from the extra makes.
However, the game was decided by two points, which shows that other scoring categories offset Cleveland’s perimeter advantage.
Indiana made five more free throws than Cleveland. Those additional free throws represented five more points from the line and helped counter the Cavaliers’ three-point advantage.
This comparison demonstrates why three-point totals should be evaluated with the full box score. A team can shoot better from long range and still lose if its opponent gains an advantage elsewhere.
Free-throw production
Indiana made 14 of 20 free throws, while Cleveland made nine of 13. The Pacers converted five more free throws overall.
Their free-throw percentage was listed at 70%, just above Cleveland’s 69%. The more important difference was the number of attempts.
Free throws are valuable because they offer scoring opportunities without requiring a field-goal attempt. In a two-point game, five additional successful free throws can be a meaningful part of the explanation.
The supplied statistics do not establish exactly which individual fouls produced those attempts or when the free throws occurred. A play-by-play record would be needed to connect them to particular moments in the game.
Rebounding and second chances
Cleveland collected 50 total rebounds, four more than Indiana’s 46. The Cavaliers also held a narrow advantage in offensive rebounds, 11 to 10.
Offensive rebounds can create additional scoring chances by allowing a team to recover the ball after a missed shot. Defensive rebounds help end an opponent’s possession.
Cleveland’s rebounding advantage did not translate into a win. That does not mean the rebounds were unimportant. It means Indiana found other ways to gain an advantage.
A fuller analysis would compare second-chance points, points in the paint, and the number of possessions created from offensive rebounds. Those figures are not included in the supplied data and should not be estimated.
Assists and ball movement
Indiana recorded 28 assists, while Cleveland finished with 24. This four-assist difference supports the view that the Pacers distributed the ball more frequently on made baskets.
Haliburton’s 10 assists accounted for a substantial part of Indiana’s playmaking output. Andrew Nembhard added seven assists, giving Indiana two players with strong assist totals.
Cleveland’s leading listed assist total was six from Jerome. Merrill and Wade each added four, while Porter Jr. recorded three.
Assists are useful for evaluating ball movement, but they do not capture every aspect of offensive creation. A player can create an open shot that a teammate misses, or draw defensive attention without receiving an assist.
Even with those limitations, Indiana’s four-assist advantage is a meaningful part of the statistical comparison.
Turnovers and possession management
Cleveland committed 11 turnovers, while Indiana committed nine. The Pacers therefore gave the ball away two fewer times.
Turnovers can be costly because they end possessions without a field-goal attempt. They may also create transition opportunities for the opposing team.
The two-turnover difference was not enormous, but it mattered in a close game. Indiana combined its lower turnover total with four more assists, suggesting a more productive balance between creating shots and preserving possession.
The available team statistics do not identify how many points either team scored directly from turnovers. That information would be useful for determining how much this category affected the final score.
Defensive blocks
The largest defensive difference was blocks. Indiana recorded 11, compared with Cleveland’s three.
Turner contributed four blocks, Haliburton recorded three, and Toppin added two, according to the supplied player lines. The remaining two blocks are not individually accounted for in the available summary.
Indiana’s total suggests a substantial presence in contesting shots near the basket. Blocks do not capture all defensive value, but this difference stands out when compared with the much smaller margins in rebounds, assists, and turnovers.
Cleveland’s perimeter shooting was more accurate, but Indiana’s rim protection provided a contrasting defensive strength.
What Decided the Cavaliers-Pacers Game?
The final score was close, and no single team statistic completely explains the outcome. The most useful approach is to examine how the major advantages interacted.
1. Indiana’s balanced scoring kept the offense productive
Haliburton scored 23 points, Nesmith added 22, and Walker contributed 15. Turner and Mathurin each scored 13, while Siakam and Toppin reached double figures with 10 apiece.
This spread of scoring gave Indiana several options. Cleveland could not judge the Pacers’ attack solely through Haliburton’s individual production.
The balanced scoring also meant Indiana could receive useful contributions from different positions. That variety is valuable when the opposing defense changes coverage or concentrates on a leading scorer.
2. Rim protection helped offset Cleveland’s outside shooting
Cleveland made 17 three-pointers, three more than Indiana. Nevertheless, the Pacers recorded eight more blocks.
These categories reflect different parts of the game. Three-point shooting rewards perimeter accuracy, while blocks measure shots rejected by defenders.
Indiana’s 11 blocks suggest that the Pacers made Cleveland work around the basket. The figures alone do not prove that every block prevented a likely score, but they establish a clear difference in recorded rim protection.
3. Indiana created more assists and committed fewer turnovers
Indiana’s 28 assists exceeded Cleveland’s 24. The Pacers also committed two fewer turnovers.
Together, these numbers point to a modest advantage in possession management and assisted scoring. Indiana generated more assists without giving the ball away as often.
The difference was not large enough to explain the final result independently, but it fits the broader pattern of a team that found several ways to remain efficient.
4. Free throws helped close the scoring gap
Indiana made 14 free throws compared with Cleveland’s nine. Cleveland’s three extra three-pointers were worth nine points from those additional makes, while Indiana’s five extra free throws represented five points.
This does not mean those categories alone determined the result, because the teams also differed in two-point baskets and other possessions. However, they show how Indiana could win despite making fewer three-pointers.
The full scoring picture matters more than any isolated shooting statistic.
5. The fourth quarter favored Indiana
Indiana scored 33 points in the final quarter, while Cleveland scored 30. After Cleveland’s strong second quarter, the Pacers recovered ground in the third and fourth periods.
The three-point fourth-quarter advantage was important because the final margin was two points. Still, quarter totals do not reveal the precise sequence of decisive plays.
Without a verified play-by-play account, it would be misleading to name a particular shot, turnover, or defensive stop as the confirmed deciding moment.
Player Matchups and Individual Performance
Individual comparisons help explain how the game developed, but they should account for each player’s role rather than simply ranking everyone by points.
Ty Jerome vs Tyrese Haliburton
Jerome finished with 24 points and six assists, while Haliburton recorded 23 points and 10 assists.
Jerome scored one more point, but Haliburton recorded four more assists and six more rebounds. Haliburton also had three blocks listed in his player line.
This comparison shows two different forms of offensive contribution. Jerome supplied high-volume scoring for Cleveland, while Haliburton combined scoring with greater playmaking output.
The numbers do not establish which player was more efficient because the supplied summary does not provide their complete shooting attempts or minutes. Nevertheless, Haliburton’s combination of 23 points and 10 assists was a major part of Indiana’s balanced attack.
De’Andre Hunter vs Aaron Nesmith
Hunter produced 23 points and 11 rebounds, while Nesmith recorded 22 points and six rebounds.
Hunter had a one-point advantage in scoring and collected five more rebounds. He also recorded two steals and one block in the supplied statistics.
Nesmith, meanwhile, delivered 22 points to support Indiana’s leading scorer. His output was particularly valuable because the Pacers needed contributions from more than one offensive option.
Hunter’s all-around numbers were impressive, but the team result went Indiana’s way. Individual production and team success are related, yet they are not interchangeable measures.
Jarrett Allen and Tristan Thompson vs Indiana’s interior defense
Allen recorded 10 rebounds, and Thompson collected 12. Their combined 22 rebounds represented a substantial share of Cleveland’s total.
Indiana’s Turner recorded 13 points, seven rebounds, and four blocks. Toppin added 10 points, four rebounds, and two blocks.
This contrast highlights different contributions from the frontcourt players. Cleveland’s listed centers supplied considerable rebounding, while Indiana’s interior players contributed more recorded blocks.
Rebounding and rim protection are both important, but they solve different defensive problems. A rebound secures possession after a missed shot, while a block can stop or alter a shot attempt before it reaches the basket.
Cleveland’s supporting scorers vs Indiana’s depth
Merrill recorded 15 points, and Okoro added 13. Porter Jr. was listed with 16 points in the detailed summary, though the conflicting Tyson entry requires verification.
Indiana had five players with at least 13 points: Haliburton, Nesmith, Walker, Turner, and Mathurin. Siakam and Toppin also reached double figures.
The distribution suggests that Indiana had several dependable scoring contributors in this particular game. Cleveland also received support beyond its leading scorers, but the Pacers’ overall combination of scoring, passing, and shot blocking proved sufficient for a two-point win.
Season Series: Cleveland Cavaliers vs Indiana Pacers in 2025
The April 11 contest was the third listed meeting between Cleveland and Indiana during the 2024-25 regular season. Indiana held a 2-1 advantage in the series after winning this game.
| Game date | Result | Winner |
| January 13, 2025 | Indiana 108, Cleveland 93 | Indiana Pacers |
| January 15, 2025 | Cleveland 127, Indiana 117 | Cleveland Cavaliers |
| April 11, 2025 | Indiana 114, Cleveland 112 | Indiana Pacers |
| April 13, 2025 | Indiana 126, Cleveland 118, 2OT | Indiana Pacers |
The April 13 game is included as a later listed meeting, not as part of the April 11 box score. According to the supplied data, Indiana won that contest 126-118 in double overtime.
Across the first three listed games, Indiana won twice and Cleveland won once. The results show that the teams had produced different outcomes in their earlier meetings, rather than one side winning every matchup.
The January 15 result was the highest-scoring game among the first three meetings, with Cleveland reaching 127 points. The April 11 game was much closer, ending with a two-point difference.
These results provide useful context for readers tracking the rivalry. However, season-series outcomes should not replace individual game analysis. Each contest has its own player availability, scoring distribution, and statistical patterns.
How to Interpret the Match Player Statistics Correctly
Box scores provide a useful record of a basketball game, but the numbers become more informative when readers understand their limits.
Points do not measure shooting efficiency by themselves
A player who scores 24 points may have an excellent or an inefficient shooting night. The difference depends on field-goal attempts, three-point attempts, free throws, and turnovers.
For example, Jerome’s 24 points establish that he was Cleveland’s leading scorer in the detailed data. His full shooting line would be necessary to calculate his exact field-goal efficiency and true shooting percentage.
Readers should avoid assuming that the highest scorer was automatically the most efficient player.
Rebounds should be separated by type
Offensive rebounds create potential second chances, while defensive rebounds generally help end an opponent’s possession.
Cleveland recorded 11 offensive rebounds and 39 defensive rebounds. Indiana had 10 offensive rebounds and 36 defensive rebounds.
The Cavaliers therefore held a four-rebound advantage overall, with a small advantage on both the offensive and defensive glass. Those totals describe possession recovery, but they do not reveal how many additional points came from second chances.
Assists show only part of playmaking
Haliburton’s 10 assists indicate a major passing contribution. However, assists do not measure every pass that creates an advantage or every action that draws defenders away from a teammate.
Indiana’s 28 assists compared with Cleveland’s 24 offer a useful team-level comparison. They should be read alongside shooting percentages and turnovers to understand how each offense converted possessions into scoring opportunities.
Plus/minus needs context
Hunter’s listed +18 and Haliburton’s listed +15 are notable figures. They indicate that their respective teams outscored the opponent during their time on the floor by those margins.
However, plus/minus is influenced by teammates, opponents, substitutions, and the situations in which a player enters the game. It should not be used alone to rank individual performances.
Combining plus/minus with points, rebounds, assists, defensive statistics, and available video evidence creates a more balanced assessment.
Source and Statistical Accuracy
The statistics in this article are based on the ESPN game information supplied for April 11, 2025. Readers who need to verify the figures can consult the ESPN official box score.
A few limitations deserve attention before these figures are republished elsewhere:
- Player scoring discrepancy: The supplied key-scorer summary lists Jaylon Tyson with 16 points, while his detailed entry lists zero points and one rebound. Craig Porter Jr. is listed with 16 points in the detailed entries. This conflict should be checked against the original box score.
- Incomplete player lines: Some individual assist, steal, and block totals were not supplied. Missing values should not be presented as verified zeroes.
- Rounded shooting percentages: The team shooting percentages are shown as supplied. Exact calculations from makes and attempts can produce slightly different rounded values.
- No unsupported play-by-play claims: The quarter scores and box-score figures support a statistical explanation of the result, but they do not independently identify the precise play that decided the game.
These distinctions matter because a useful sports statistics article should make it easy to separate verified figures from interpretation. A transparent account is more valuable than a confident explanation built on incomplete information.
Frequently Asked Questions
1. Who won the Cleveland Cavaliers vs Pacers game on April 11, 2025?
The Indiana Pacers defeated the Cleveland Cavaliers 114-112 at Gainbridge Fieldhouse in Indianapolis. Indiana scored 33 points in the fourth quarter to Cleveland’s 30.
2. Who was the leading scorer in the game?
Ty Jerome led Cleveland with 24 points, according to the detailed player statistics supplied. Tyrese Haliburton led Indiana with 23 points and also recorded 10 assists.
3. How many points and rebounds did De’Andre Hunter record?
Hunter recorded 23 points and 11 rebounds, along with two assists, two steals, and one block. He also had the highest listed plus/minus among Cleveland players at +18.
4. Which team recorded more blocks?
Indiana recorded 11 blocks, while Cleveland recorded three. Myles Turner led the Pacers with four blocks, and Haliburton recorded three in the supplied statistics.
5. Which team shot better from three-point range?
Cleveland shot better from three-point range, making 17 of 37 attempts for a listed 46%. Indiana made 14 of 41 attempts for a listed 34%.
6. Where can readers check the official player statistics?
Readers can check the ESPN box score for the April 11, 2025, game. It contains the game record and player statistics needed to verify individual totals, particularly where the supplied summary contains conflicting entries.
Conclusion
The Cleveland Cavaliers vs Pacers match player stats reveal how Indiana earned a narrow 114-112 victory on April 11, 2025. Haliburton’s 23 points and 10 assists, Nesmith’s 22 points, and Turner’s four blocks highlighted Indiana’s balanced performance. Cleveland countered with Jerome’s 24 points, Hunter’s 23 points and 11 rebounds, and a stronger three-point shooting percentage.
The most notable team differences were Indiana’s 11 blocks, 28 assists, and nine turnovers compared with Cleveland’s three blocks, 24 assists, and 11 turnovers. Cleveland collected more rebounds and made more three-pointers, but those advantages were not enough to secure the win.
The game demonstrates why basketball analysis requires more than comparing final scores or leading scorers. Shooting efficiency, free throws, ball movement, turnovers, rebounding, and defensive pressure all contribute to the final outcome. Checking the original box score is also essential when player entries conflict or detailed statistics are missing.