Philadelphia Eagles vs New York Giants Match Player Stats
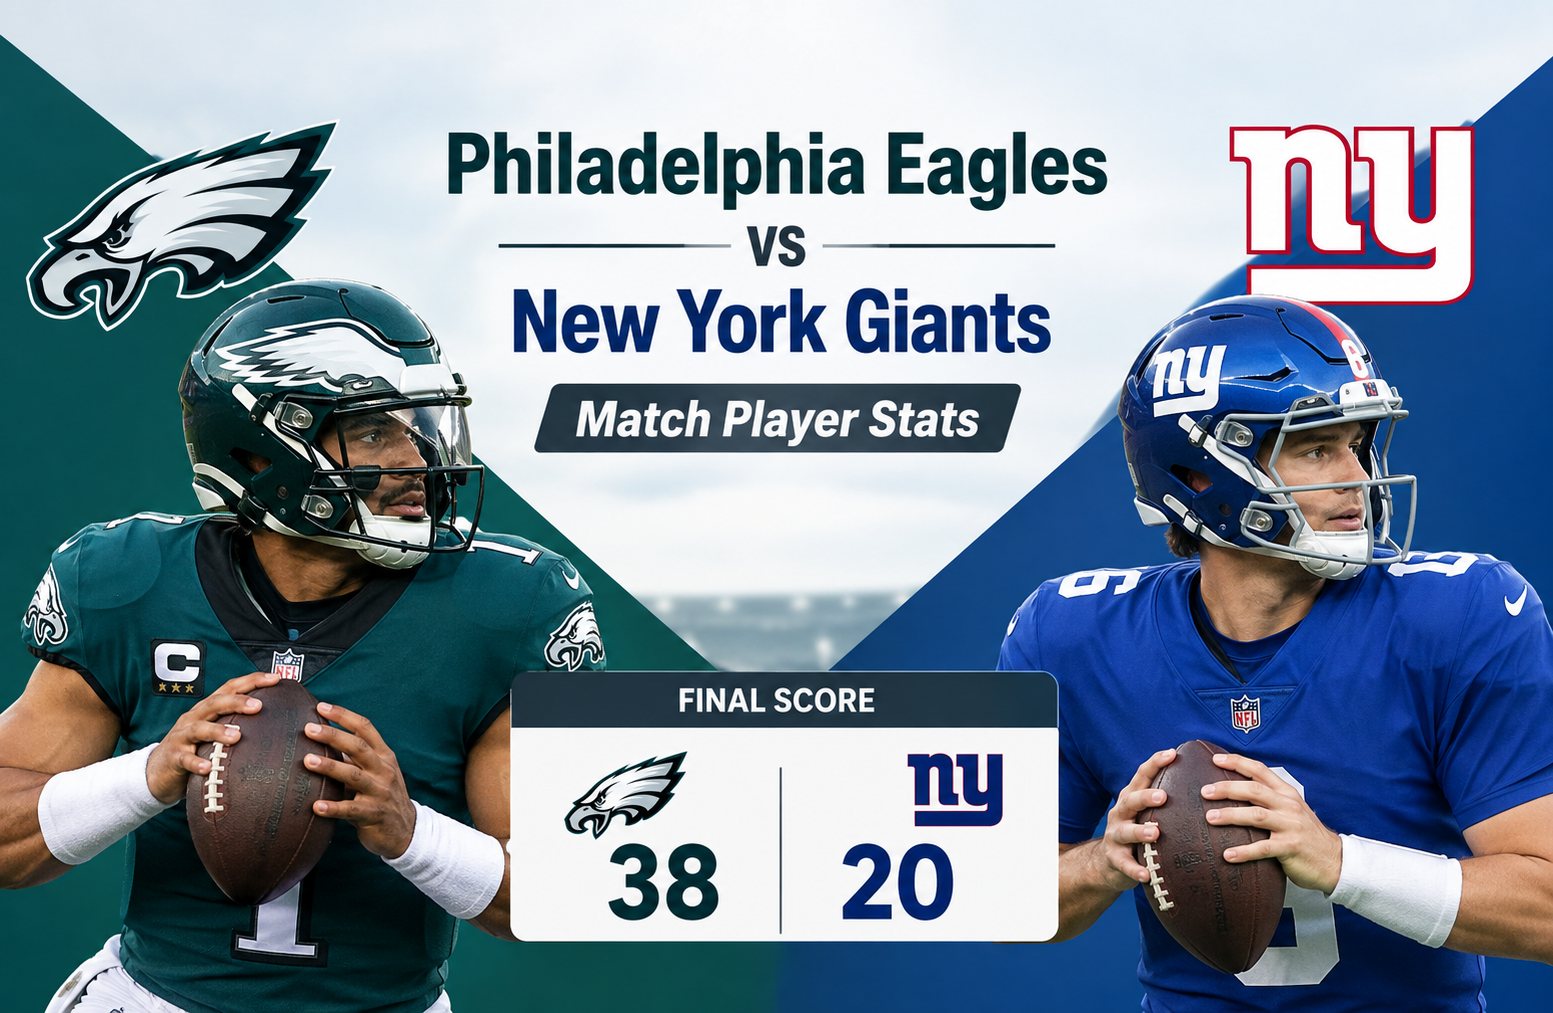
The Philadelphia Eagles vs New York Giants match player stats from October 26, 2025, tell a clear story of Philadelphia’s offensive control in a 38-20 victory. The Eagles combined 276 rushing yards with 179 passing yards, while Jalen Hurts delivered four touchdown passes without an interception. Saquon Barkley added 150 rushing yards on only 14 carries, including a 65-yard touchdown run, giving Philadelphia a major advantage in explosive plays and overall offensive efficiency.
The final score alone does not fully explain how the game unfolded. Philadelphia scored 14 points in both the second and fourth quarters, while the Giants managed only 13 points across the middle two quarters. New York finished with 193 passing yards and 68 rushing yards, but the Giants struggled to consistently sustain their offense against an Eagles defense that recorded five sacks and seven tackles for loss.
This breakdown examines the major player performances, team statistics, passing and rushing numbers, receiving production, defensive contributions, special teams results, and the most important lessons from the matchup. The figures used throughout this article come from the ESPN box score for Giants vs. Eagles, Game ID 401772867.
Philadelphia Eagles vs New York Giants Match Player Stats at a Glance
The most important numbers immediately show why Philadelphia won the game.
| Category | New York Giants | Philadelphia Eagles |
| Final Score | 20 | 38 |
| Record After Game | 2-6 | 6-2 |
| Away/Home Record | 0-5 away | 3-1 home |
| Passing Yards | 193 | 179 |
| Rushing Yards | 68 | 276 |
| Total Rushing Attempts | 21 | 33 |
| Passing Leader | Jaxson Dart | Jalen Hurts |
| Rushing Leader | Tyrone Tracy Jr. | Saquon Barkley |
| Receiving Leader | Wan’Dale Robinson | DeVonta Smith |
| Team Sacks | 4 | 5 |
| Interceptions | 0 | 0 |
| Fumbles | 0 | 0 |
| Field Goals | 2/2 | 1/2 |
The biggest statistical difference was on the ground. Philadelphia rushed for 276 yards, compared with just 68 yards for New York. That 208-yard gap created a major advantage in offensive balance and helped the Eagles control the game.
Philadelphia also produced five sacks compared with four from the Giants. Although both defenses generated pressure, the Eagles were much more effective at pairing their defensive work with an explosive offensive performance.
How the Game Developed
The scoring pattern provides useful context for the individual statistics.
The Giants and Eagles each scored seven points in the opening quarter. That produced a competitive start, but Philadelphia began to separate itself in the second quarter.
The Eagles scored 14 points in the second quarter while New York added only three. At halftime, Philadelphia had established a significant advantage.
The third quarter was relatively quiet from a scoring perspective. New York added three points and Philadelphia also scored three.
The fourth quarter then belonged to Philadelphia again. The Eagles scored 14 points while the Giants scored seven.
The quarter-by-quarter scoring was:
| Quarter | Giants | Eagles |
| First | 7 | 7 |
| Second | 3 | 14 |
| Third | 3 | 3 |
| Fourth | 7 | 14 |
| Total | 20 | 38 |
This pattern highlights an important feature of the matchup. Philadelphia did not simply build an early lead and hold on. The Eagles created separation in the second quarter and then reinforced that advantage in the fourth.
Jalen Hurts Leads Philadelphia’s Passing Attack
Jalen Hurts was one of the central figures in the game.
The Eagles quarterback completed 15 of 20 passes for 179 yards, averaging 9.0 yards per attempt. Most importantly, he threw four touchdown passes without an interception.
His reported numbers included:
- 15 completions
- 20 attempts
- 179 passing yards
- 9.0 yards per attempt
- 4 touchdowns
- 0 interceptions
- 4 sacks
- 28 sack yards
- 66.2 QBR
- 141.5 passer rating
A 141.5 passer rating is particularly notable because Hurts combined efficiency with touchdown production. He did not need a massive passing-yard total to make a major impact.
That is an important distinction when evaluating quarterback performances. Passing yardage is useful, but it should not be considered in isolation. Hurts produced four touchdowns on only 20 attempts and avoided turnovers.
His performance also benefited from Philadelphia’s dominant running game. With Barkley and the Eagles rushing attack consistently generating yardage, the offense did not have to become one-dimensional.
Hurts’ Efficiency Was More Important Than Volume
A quarterback can throw for 300 yards and still have a poor game if those yards come with turnovers, stalled drives, or inefficient attempts.
Hurts had a different type of statistical profile.
He threw for 179 yards but averaged 9.0 yards per attempt and recorded four touchdown passes. That suggests Philadelphia was getting significant value from its passing opportunities.
The four touchdown passes were especially important because the Eagles finished with four receiving touchdowns as a team.
The quarterback’s four touchdown passes and zero interceptions also meant Philadelphia avoided giving the Giants extra possessions through the passing game.
Jaxson Dart’s Numbers for the Giants
Jaxson Dart led the Giants’ passing attack with 14 completions on 24 attempts for 193 yards.
His statistical line was:
- 14 completions
- 24 attempts
- 193 passing yards
- 8.0 yards per attempt
- 1 touchdown
- 0 interceptions
- 5 sacks
- 15 sack yards
- 59.4 QBR
- 98.1 passer rating
Dart’s 193 passing yards were higher than Hurts’ 179 yards, but the final score demonstrates why passing yardage alone does not determine the outcome.
Dart averaged 8.0 yards per attempt, which was respectable, and he avoided interceptions. However, the Giants struggled to complement the passing attack with an effective rushing game.
The five sacks also affected the Giants’ offensive efficiency. Pressure can change the rhythm of an offense even when the quarterback avoids throwing an interception.
Comparing the Two Quarterbacks
| Statistic | Jaxson Dart | Jalen Hurts |
| Completions | 14 | 15 |
| Attempts | 24 | 20 |
| Passing Yards | 193 | 179 |
| Yards/Attempt | 8.0 | 9.0 |
| Touchdowns | 1 | 4 |
| Interceptions | 0 | 0 |
| Sacks | 5 | 4 |
| Sack Yards | 15 | 28 |
| QBR | 59.4 | 66.2 |
| Passer Rating | 98.1 | 141.5 |
The comparison illustrates the difference between volume and impact.
Dart actually threw for more yards, but Hurts produced three more touchdown passes while attempting four fewer passes. Philadelphia therefore extracted considerably more scoring value from its passing opportunities.
Saquon Barkley Dominates the Ground Game
If one statistic best explains the offensive difference in the matchup, it is Saquon Barkley’s rushing performance.
Barkley carried the ball 14 times for 150 yards, averaging 10.7 yards per carry. He also recorded a touchdown and broke off a 65-yard run.
His line:
- 14 carries
- 150 rushing yards
- 10.7 yards per carry
- 1 touchdown
- 65-yard long
That is an extremely explosive rushing performance.
Barkley averaged more than 10 yards every time he carried the football. More importantly, the 65-yard long run gave Philadelphia a major field-position and scoring advantage.
His contribution was not simply about accumulating yards. The explosive nature of his rushing created opportunities that forced the Giants defense to respond to Philadelphia’s ground attack.
Barkley’s Efficiency Changed the Game
Philadelphia ran the ball 33 times for 276 yards.
That means the Eagles averaged 8.4 yards per rushing attempt as a team.
Barkley was the biggest contributor, but the team total shows that the Eagles’ success was not dependent on one isolated play. The 276-yard total demonstrates broad effectiveness in the rushing attack.
The Giants, by contrast, ran for only 68 yards on 21 attempts, an average of 3.2 yards per carry.
That created a huge efficiency gap.
Tyrone Tracy Jr. Leads Giants Rushing
Tyrone Tracy Jr. led New York’s rushing production with 10 carries for 39 yards.
His numbers were:
- 10 carries
- 39 yards
- 3.9 yards per carry
- 0 touchdowns
- 6-yard long
Tracy’s 39 rushing yards represented more than half of the Giants’ 68 rushing yards.
The Giants finished with 21 rushing attempts for 68 yards, averaging only 3.2 yards per carry as a team.
The contrast with Philadelphia was substantial.
| Rushing Statistic | Giants | Eagles |
| Attempts | 21 | 33 |
| Yards | 68 | 276 |
| Average | 3.2 | 8.4 |
| Long | 8 | 65 |
| Touchdowns | 1 | 1 |
The Eagles gained 208 more rushing yards than the Giants.
That was arguably the most important statistical difference in the game.
The Receiving Numbers Tell Another Part of the Story
Philadelphia’s passing production was distributed efficiently across its receiving group.
DeVonta Smith led the Eagles in receiving with:
- 6 receptions
- 84 yards
- 14.0 yards per reception
- 0 touchdowns
- 26-yard long
- 9 targets
The Eagles finished with 15 receptions for 179 yards and four receiving touchdowns on 20 targets.
That means Philadelphia averaged 11.9 yards per reception as a team.
The four receiving touchdowns are particularly important because they correspond directly with Hurts’ four touchdown passes.
DeVonta Smith’s Role
Smith did not lead Philadelphia in receiving touchdowns because the Eagles spread their scoring production around the receiving unit.
His six receptions were the most among Eagles receivers, and his 84 yards accounted for nearly half of Philadelphia’s passing yardage.
His 26-yard longest reception also demonstrates his ability to create meaningful gains without requiring a large number of catches.
The nine targets show that he remained a significant part of the passing plan.
Wan’Dale Robinson Leads the Giants in Receiving
Wan’Dale Robinson was the Giants’ leading receiver in the provided box score.
He recorded:
- 3 receptions
- 48 yards
- 16.0 yards per reception
- 0 touchdowns
- 34-yard long
- 4 targets
New York finished with 14 receptions for 193 yards on 22 targets.
The Giants therefore averaged 13.8 yards per reception, slightly higher than Philadelphia’s 11.9 yards per reception.
This is another example of why raw yardage totals need context. The Giants were capable of producing efficient gains through the air, but their overall offense did not match Philadelphia’s scoring output.
Philadelphia Eagles vs New York Giants Match Player Stats: Receiving Comparison
| Receiving Statistic | Giants | Eagles |
| Team Receptions | 14 | 15 |
| Team Targets | 22 | 20 |
| Receiving Yards | 193 | 179 |
| Yards per Reception | 13.8 | 11.9 |
| Receiving Touchdowns | 1 | 4 |
| Long Reception | 34 yards | 40 yards |
| Leading Receiver | Wan’Dale Robinson | DeVonta Smith |
The receiving statistics reveal an interesting contrast.
New York actually gained more receiving yards than Philadelphia, with 193 compared with 179. Yet the Eagles scored four receiving touchdowns, while the Giants had only one.
That tells us the Eagles were more effective at turning passing opportunities into points.
Defensive Player Production and Team Pressure
The defensive numbers provide another important layer of analysis.
The Giants recorded:
- 61 total tackles
- 33 solo tackles
- 4 sacks
- 3 tackles for loss
- 4 passes defended
- 5 quarterback hits
Philadelphia recorded:
- 49 total tackles
- 35 solo tackles
- 5 sacks
- 7 tackles for loss
- 4 passes defended
- 6 quarterback hits
The Giants had more total tackles, 61 compared with 49.
However, Philadelphia produced more sacks, tackles for loss, and quarterback hits.
That difference matters because tackle totals can sometimes increase simply because a defense is on the field more often. Philadelphia’s lower total tackle count does not automatically indicate weaker defensive activity.
Philadelphia’s Defensive Pressure
The Eagles generated five sacks and six quarterback hits.
Those numbers indicate consistent pressure on Dart.
The Giants also produced four sacks against Hurts, so this was not a game in which Philadelphia’s offensive line completely neutralized the opposing pass rush.
The difference was that Philadelphia’s offense was much more explosive and efficient overall.
No Interceptions and No Fumbles
One of the cleanest aspects of the game was ball security.
Neither team recorded an interception.
Neither team recorded a fumble.
That means both offenses avoided the most obvious turnover mistakes.
The game therefore cannot be explained by one team repeatedly handing away possessions. Philadelphia won through offensive production, particularly its rushing attack and touchdown efficiency.
This is an important analytical point because turnovers often create misleading scorelines. In this matchup, the statistical advantage was much more directly connected to Philadelphia’s ability to gain yards and finish drives.
Special Teams Performance
Special teams also contributed to the overall statistical picture.
Graham Gano
Giants kicker Graham Gano was perfect on his field-goal attempts.
He made:
- 2 of 2 field goals
- 100 percent field-goal rate
- 47-yard long
- 2 of 2 extra points
- 8 total points
Gano’s perfect kicking performance gave New York reliable scoring when the offense reached field-goal range.
Jake Elliott
Eagles kicker Jake Elliott recorded:
- 1 of 2 field goals
- 50 percent field-goal rate
- 40-yard long
- 5 of 5 extra points
- 8 total points
Elliott scored the same eight points as Gano despite making one fewer field goal because Philadelphia scored five touchdowns and converted all five extra-point attempts.
Punting
Giants punter Jamie Gillan recorded four punts for 194 yards.
His average was 48.5 yards per punt, with a long of 58 yards and one punt inside the 20-yard line.
Philadelphia’s Braden Mann punted only once for 57 yards.
The difference in punt volume is revealing. Philadelphia’s offense was productive enough that it rarely needed to give the ball away through punts.
Kick Returns and Punt Returns
The Giants recorded five kick returns for 145 yards, averaging 29.0 yards per return.
Their longest kick return was 33 yards.
Philadelphia had three kick returns for 99 yards, averaging 33.0 yards per return, with a long of 41 yards.
On punt returns, the Eagles recorded one return by Xavier Gipson for 17 yards.
The Giants had no punt returns in the provided statistics.
These numbers show that both teams had moments of solid special teams field-position production, but the main difference remained offensive execution.
Why the 276 Rushing Yards Matter
The most significant lesson from the game is the importance of Philadelphia’s rushing efficiency.
The Eagles produced:
33 carries, 276 yards, 8.4 yards per carry.
The Giants produced:
21 carries, 68 yards, 3.2 yards per carry.
The Eagles therefore gained four times as many rushing yards while attempting only 12 additional runs.
This is not simply a volume advantage.
It is an efficiency advantage.
Philadelphia averaged 8.4 yards per rushing attempt. New York averaged 3.2.
That difference allowed Philadelphia to create explosive plays, sustain offensive momentum, and reduce the pressure on Hurts to throw on every important down.
Explosive Plays Were a Major Factor
Barkley’s 65-yard run stands out immediately.
A single 65-yard play can dramatically alter a football game because it changes field position in seconds.
The Giants’ longest team rushing play was only eight yards.
That contrast is striking.
Philadelphia’s ground attack had the ability to produce explosive gains, while New York’s rushing offense was much more limited.
The difference between a 65-yard long and an eight-yard long is not merely a box-score curiosity. It illustrates how differently the two teams were creating offensive opportunities.
Scoring Efficiency Favored Philadelphia
Philadelphia scored 38 points despite recording only 179 passing yards.
That demonstrates how much production came from the combination of rushing efficiency and touchdown conversion.
The Eagles’ 276 rushing yards provided the foundation, while Hurts’ four touchdown passes supplied the finishing production.
New York scored 20 points despite recording 193 passing yards.
The Giants’ 68 rushing yards limited their overall offensive balance.
This produces one of the clearest analytical conclusions from the game:
Philadelphia was more efficient at converting offensive production into points.
What the Quarter Scores Reveal
The quarter breakdown also helps explain the final result.
First Quarter
Both teams scored seven points.
The opening period offered little indication of the eventual 18-point margin.
Second Quarter
Philadelphia scored 14 points while New York scored three.
This was the first major turning point.
The Eagles established control before halftime and created the foundation for the final score.
Third Quarter
Both teams scored three points.
The Giants did not completely collapse after halftime, but they also did not make enough progress to erase the deficit.
Fourth Quarter
Philadelphia scored 14 points while New York scored seven.
The Eagles closed the game with another strong scoring period instead of allowing the Giants to turn the contest into a late one-score game.
A Closer Look at Offensive Balance
The Eagles’ offensive statistics show a useful relationship between passing and rushing.
Philadelphia had:
- 179 passing yards
- 276 rushing yards
- 455 combined yards from those two categories
New York had:
- 193 passing yards
- 68 rushing yards
- 261 combined yards from those two categories
Based on the supplied passing and rushing figures, Philadelphia generated 194 more combined passing and rushing yards than New York.
That is a substantial difference.
It also explains why Philadelphia could win comfortably without producing a massive passing total.
Why Passing Yards Alone Can Be Misleading
A casual reading of the box score might suggest that Dart outperformed Hurts because Dart threw for 193 yards compared with Hurts’ 179.
That conclusion would miss the larger picture.
Hurts threw four touchdown passes.
Dart threw one.
Hurts averaged 9.0 yards per attempt.
Dart averaged 8.0.
Hurts posted a 141.5 passer rating.
Dart posted a 98.1 rating.
Neither quarterback threw an interception.
The difference was therefore not about avoiding mistakes alone. Hurts was much more productive when Philadelphia reached scoring opportunities.
What the Stats Say About Saquon Barkley
Barkley’s performance is particularly significant because he produced 150 rushing yards on only 14 attempts.
His 10.7 yards per carry was well above the Eagles’ already excellent team average of 8.4.
The 65-yard touchdown run was the signature explosive play.
For anyone studying the Philadelphia offense, this performance demonstrates why a productive running back can influence more than the rushing column. A strong ground attack can create better passing conditions, force defensive adjustments, and make it harder for opponents to predict offensive intentions.
What the Stats Say About DeVonta Smith
Smith’s six receptions and 84 yards made him Philadelphia’s leading receiver by both catches and receiving yardage.
He averaged 14.0 yards per reception and recorded a 26-yard long reception.
The Eagles did not rely on one receiver for all of their touchdown production. That distribution made the passing attack more difficult to reduce to a single matchup.
Smith’s nine targets also show that he remained heavily involved even though the Eagles were extremely effective running the football.
What the Stats Say About Wan’Dale Robinson
Robinson’s three catches for 48 yards gave him the Giants’ highest receiving-yard total.
His 16.0 yards per reception was strong, and his 34-yard reception was New York’s longest listed reception.
However, he had four targets and did not record a touchdown.
His production demonstrates that New York could create chunk plays through the passing game, but the offense did not consistently turn those gains into the same level of scoring production as Philadelphia.
The Defensive Comparison
The defensive box score shows that both teams generated meaningful pressure.
The Giants recorded four sacks.
The Eagles recorded five.
The Giants had three tackles for loss.
The Eagles had seven.
The Eagles also recorded six quarterback hits compared with five for New York.
Passes defended were even at four each.
The most noticeable difference was therefore not coverage statistics but disruption in the backfield.
Philadelphia produced more tackles for loss and slightly more sacks and quarterback hits.
What This Matchup Teaches About Box Score Analysis
A useful way to analyze an NFL game is to avoid relying on one statistic.
For this matchup, the most informative categories are:
- Rushing efficiency
- Touchdown production
- Passing efficiency
- Defensive pressure
- Turnover avoidance
- Scoring by quarter
When those categories are viewed together, the 38-20 result makes sense.
Philadelphia did not need a huge passing-yard total because its rushing game was extraordinarily efficient.
The Eagles also converted their passing opportunities into four touchdowns.
Their defense generated five sacks and seven tackles for loss.
Both teams avoided turnovers, meaning Philadelphia’s advantage came primarily from execution rather than gifts from the opponent.
Philadelphia Eagles vs New York Giants Match Player Stats: Biggest Takeaways
Several conclusions stand above the rest of the statistical detail.
1. Saquon Barkley was the biggest rushing difference
Barkley produced 150 yards on 14 carries and had a 65-yard touchdown run.
2. Philadelphia dominated team rushing
The Eagles gained 276 yards on 33 attempts, compared with 68 yards on 21 attempts for New York.
3. Hurts was much more productive as a passer
Hurts threw four touchdowns without an interception and posted a 141.5 rating.
4. Dart produced respectable passing numbers
Dart threw for 193 yards and one touchdown without an interception, but he was sacked five times.
5. DeVonta Smith led Philadelphia’s receiving group
Smith recorded six receptions for 84 yards on nine targets.
6. Wan’Dale Robinson led the Giants
Robinson caught three passes for 48 yards and averaged 16.0 yards per reception.
7. Both teams protected the football
There were no interceptions and no fumbles recorded for either team.
8. Philadelphia generated more defensive disruption
The Eagles recorded five sacks and seven tackles for loss.
Frequently Asked Questions
What was the final score between the Eagles and Giants?
The Philadelphia Eagles defeated the New York Giants 38-20 on October 26, 2025.
Who was the Eagles’ leading passer?
Jalen Hurts led Philadelphia with 15 completions on 20 attempts for 179 yards, four touchdowns, and zero interceptions.
Who was the Giants’ leading passer?
Jaxson Dart completed 14 of 24 passes for 193 yards, one touchdown, and zero interceptions.
How many rushing yards did Saquon Barkley have?
Saquon Barkley rushed for 150 yards on 14 carries, averaging 10.7 yards per carry. His longest run was 65 yards, and he scored one rushing touchdown.
Who led the Eagles in receiving?
DeVonta Smith led Philadelphia with six receptions for 84 yards on nine targets.
Which team had more rushing yards?
Philadelphia had a major advantage on the ground. The Eagles rushed for 276 yards, while the Giants finished with 68 rushing yards.
Conclusion
The October 26, 2025 matchup between Philadelphia and New York was defined by Philadelphia’s ability to create explosive plays and convert offensive opportunities into touchdowns. The Philadelphia Eagles vs New York Giants match player stats show that the final 38-20 score was supported by several major statistical advantages rather than one isolated performance.
The biggest difference was the rushing game. Philadelphia generated 276 rushing yards on 33 attempts, averaging 8.4 yards per carry. Saquon Barkley was the centerpiece of that production with 150 yards on only 14 carries and a 65-yard touchdown run.
Jalen Hurts added another decisive element through the air. His 179 passing yards were not a huge volume number, but four touchdown passes and zero interceptions produced an outstanding 141.5 passer rating.
The Giants had some positive individual numbers. Jaxson Dart threw for 193 yards without an interception, while Wan’Dale Robinson averaged 16.0 yards per reception. Graham Gano also converted both field-goal attempts. However, New York could not match Philadelphia’s rushing production or touchdown efficiency.
Defensively, both teams generated pressure, with the Eagles recording five sacks and the Giants recording four. Neither side produced an interception or fumble, making Philadelphia’s victory primarily a product of superior offensive efficiency, explosive rushing, and stronger scoring production.
Taken together, the statistics show why Philadelphia controlled the matchup. The Eagles were more productive on the ground, more efficient in the passing game, more effective at scoring touchdowns, and slightly more disruptive defensively. Those factors provide a much clearer explanation of the game than the final score alone.