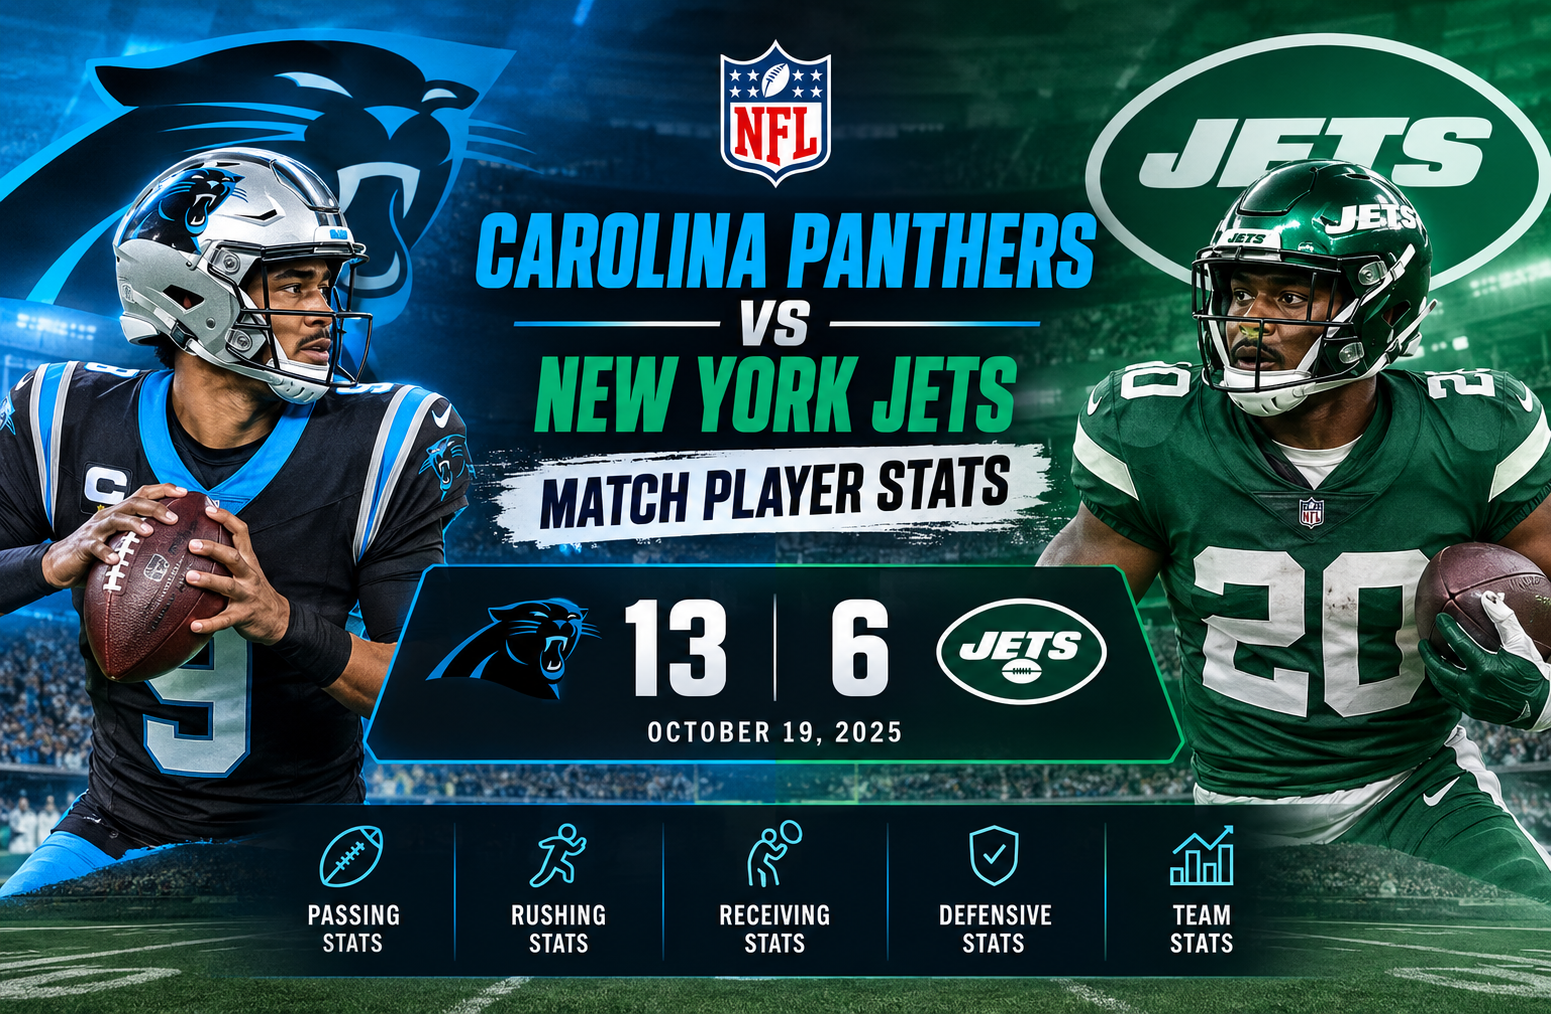
Carolina Panthers vs New York Jets Match Player Stats
The carolina panthers vs new york jets match player stats from October 19, 2025 tell the story of a low-scoring NFL game decided by defensive pressure, quarterback efficiency, and Carolina’s ability to create just enough explosive plays. The Panthers defeated the Jets 13-6 at MetLife Stadium, improving to 4-3 while New York fell to 0-7. Official NFL game center
This was not a game dominated by huge passing numbers or a single overwhelming rushing performance. Instead, the box score shows a much more tactical contest. Carolina produced 177 passing yards and 125 rushing yards, while New York finished with 139 passing yards and 81 rushing yards. The Panthers also recorded six sacks and intercepted Tyrod Taylor twice, creating a defensive advantage that ultimately proved decisive.
For readers looking beyond the final score, the individual numbers provide an even clearer picture. Xavier Legette led Carolina’s receiving production with 92 yards and a touchdown, Rico Dowdle supplied 79 rushing yards, Bryce Young contributed a touchdown pass before leaving the game, and Carolina’s defense repeatedly disrupted the Jets’ passing attack.
Carolina Panthers vs New York Jets Match Player Stats: Game Overview
The Panthers won 13-6, with Carolina scoring in the first, second, and third quarters while New York managed one field goal in the second quarter and another in the fourth.
| Category | Carolina Panthers | New York Jets |
| Final Score | 13 | 6 |
| Passing Yards | 177 | 139 |
| Rushing Yards | 125 | 81 |
| Total Passing TDs | 1 | 0 |
| Interceptions Thrown | 0 | 2 |
| Sacks Allowed | 2 | 6 |
| Team Passing Rating | 87.8 | 37.9 |
| Total Tackles | 60 | 75 |
| Sacks | 6 | 2 |
| Pass Deflections | 9 | 7 |
The most important difference was not simply total yardage. Carolina protected the football better, generated considerably more pressure, and turned its defensive opportunities into possessions that New York struggled to convert into touchdowns.
The Jets actually recorded more total defensive tackles, 75 compared with Carolina’s 60. That figure is partly a reflection of how often Carolina ran the football and how frequently New York’s defenders had to finish plays. Tackles alone therefore do not tell the complete story.
The more meaningful defensive statistics were sacks and interceptions. Carolina recorded six sacks and two interceptions. New York managed two sacks and no interceptions.
That combination helped Carolina control the game’s scoring environment.
Bryce Young Passing Performance
Bryce Young completed 15 of 25 passes for 138 yards, averaging 5.5 yards per attempt. He threw one touchdown and no interceptions, finishing with an 88.4 passer rating and a 60.1 QBR according to the supplied game data.
The most important aspect of Young’s performance was his ball security.
He did not produce a high-volume passing performance, but Carolina did not need one. The Panthers were able to combine his controlled passing with a productive running game and an aggressive defense.
Young’s touchdown connection with Xavier Legette became particularly important because it represented Carolina’s only passing touchdown of the game.
Young also contributed 10 rushing yards on two attempts. His rushing production was modest, but those yards added another element to Carolina’s offensive efficiency.
Young’s Passing Line
| Statistic | Bryce Young |
| Completions | 15 |
| Attempts | 25 |
| Completion Rate | 60.0% |
| Passing Yards | 138 |
| Yards per Attempt | 5.5 |
| Touchdowns | 1 |
| Interceptions | 0 |
| Sacks | 1 |
| Sack Yards Lost | 12 |
| QBR | 60.1 |
| Passer Rating | 88.4 |
One important context point is that Young did not finish the game. He left after suffering an ankle injury, with Andy Dalton taking over. NFL reporting confirmed that Young exited the second half and did not return.
That matters when evaluating his statistics because the final Carolina passing totals were split between two quarterbacks.
Andy Dalton’s Role After Young’s Exit
Andy Dalton completed four of seven passes for 60 yards. He averaged 8.6 yards per attempt and finished without a touchdown or interception.
His 60 passing yards represented a significant portion of Carolina’s total passing production despite his limited workload.
Dalton also recorded two rushing attempts for minus two yards.
| Statistic | Andy Dalton |
| Completions | 4 |
| Attempts | 7 |
| Passing Yards | 60 |
| Yards per Attempt | 8.6 |
| Touchdowns | 0 |
| Interceptions | 0 |
| Sacks | 1 |
| Sack Yards Lost | 9 |
| QBR | 28.0 |
| Passer Rating | 85.4 |
Dalton’s involvement demonstrates why team-level statistics can sometimes be more useful than looking only at the starting quarterback’s numbers.
Carolina finished with 177 passing yards, and both quarterbacks contributed to that total.
The Panthers did not need Dalton to produce a large statistical game. His primary task was to maintain the offense, avoid turnovers, and help Carolina protect its lead.
Xavier Legette Was Carolina’s Leading Receiver
Xavier Legette was the standout receiving performer in this matchup.
He caught nine passes for 92 yards and one touchdown on 11 targets. His average reception gained 10.2 yards, while his longest catch went for 33 yards.
| Statistic | Xavier Legette |
| Receptions | 9 |
| Targets | 11 |
| Receiving Yards | 92 |
| Yards per Reception | 10.2 |
| Touchdowns | 1 |
| Long Reception | 33 yards |
Legette accounted for almost half of Carolina’s 198 receiving yards.
His nine receptions also represented nearly half of the team’s 19 completions.
That level of involvement is especially notable because Carolina did not have a particularly high-volume passing offense. When a team throws 32 passes and one receiver sees 11 targets, that receiver becomes a central component of the offensive plan.
The touchdown was even more valuable because the Panthers scored only 13 points overall.
In a game with limited scoring opportunities, a single touchdown reception can have an outsized effect on the final result.
Tetairoa McMillan Provides Secondary Receiving Production
Tetairoa McMillan caught three passes for 33 yards on five targets.
His 11.0 yards per reception was slightly higher than Legette’s average, although his overall workload was much smaller.
| Player | REC | YDS | AVG | TD | TGTS |
| Xavier Legette | 9 | 92 | 10.2 | 1 | 11 |
| Tetairoa McMillan | 3 | 33 | 11.0 | 0 | 5 |
| Chuba Hubbard | 2 | 24 | 12.0 | 0 | 3 |
| Mitchell Evans | 2 | 24 | 12.0 | 0 | 3 |
| Rico Dowdle | 1 | 17 | 17.0 | 0 | 2 |
| Jimmy Horn Jr. | 1 | 8 | 8.0 | 0 | 2 |
| Tommy Tremble | 1 | 0 | 0.0 | 0 | 2 |
The distribution shows a relatively concentrated passing attack.
Legette was the clear focal point, while McMillan and the running backs supplied secondary production.
Rico Dowdle Led Carolina’s Rushing Attack
Rico Dowdle carried the ball 17 times for 79 yards, averaging 4.6 yards per carry.
His longest run was 13 yards.
| Statistic | Rico Dowdle |
| Carries | 17 |
| Rushing Yards | 79 |
| Average | 4.6 |
| Touchdowns | 0 |
| Long | 13 yards |
Dowdle’s contribution was important because Carolina finished with 125 rushing yards on 36 attempts.
That equates to 3.5 yards per carry as a team.
The Panthers did not dominate on the ground on a per-carry basis, but they maintained enough rushing volume to prevent the offense from becoming completely dependent on passing.
Chuba Hubbard’s Rushing Numbers
Chuba Hubbard received 14 carries and gained 31 yards.
His average was 2.2 yards per attempt, with a longest run of 11 yards.
The contrast between Dowdle and Hubbard is one of the more interesting details in the box score.
Dowdle produced 79 yards on 17 carries, while Hubbard needed 14 attempts to produce 31 yards. Together, they accounted for 110 of Carolina’s 125 rushing yards.
This suggests that Dowdle was the more productive individual ball carrier in this particular matchup, although one game should not be treated as a complete evaluation of either player’s overall ability.
Carolina’s Team Rushing Performance
Carolina recorded:
- 36 rushing attempts
- 125 rushing yards
- 3.5 yards per carry
- 0 rushing touchdowns
- 13-yard longest run
Bryce Young added 10 yards, Jimmy Horn Jr. contributed seven yards, and Andy Dalton finished with minus two yards.
The Panthers therefore had multiple contributors without relying entirely on one player.
The most useful takeaway is that Carolina combined moderate rushing efficiency with defensive dominance. That combination allowed the team to win despite scoring only 13 points.
Tyrod Taylor’s Difficult Passing Performance
Tyrod Taylor started at quarterback for New York and completed 10 of 22 passes for 126 yards.
He averaged 5.7 yards per attempt, threw two interceptions, and recorded no touchdowns.
His supplied statistical line includes a 25.9 passer rating and 11.4 QBR.
| Statistic | Tyrod Taylor |
| Completions | 10 |
| Attempts | 22 |
| Passing Yards | 126 |
| Yards per Attempt | 5.7 |
| Touchdowns | 0 |
| Interceptions | 2 |
| Sacks | 3 |
| Sack Yards Lost | 12 |
| QBR | 11.4 |
| Passer Rating | 25.9 |
The two interceptions were especially costly because Carolina did not throw an interception of its own.
That created a four-turnover difference in terms of interceptions thrown, with New York accounting for both giveaways.
Taylor also absorbed three sacks.
The result was a passing performance that struggled to generate points despite completing 45.5% of his attempts.
Justin Fields Added Rushing Value
Justin Fields completed six of 12 passes for 46 yards.
He did not throw a touchdown or interception and recorded a 59.7 passer rating in the supplied data.
His rushing numbers were more productive on a per-attempt basis.
Fields carried four times for 22 yards, averaging 5.5 yards per carry.
| Statistic | Justin Fields |
| Passing Completions | 6 |
| Passing Attempts | 12 |
| Passing Yards | 46 |
| Passing TDs | 0 |
| Passing INTs | 0 |
| Rushing Attempts | 4 |
| Rushing Yards | 22 |
| Rushing Average | 5.5 |
Fields therefore contributed 68 combined passing and rushing yards.
However, the Jets could not turn those yards into touchdowns.
New York’s Rushing Attack
Breece Hall led the Jets in rushing attempts and yards.
He carried 11 times for 38 yards, averaging 3.5 yards per carry.
Fields followed with 22 yards on four attempts, while Tyrod Taylor added 11 yards on three carries.
Isaiah Davis contributed 10 yards on two attempts.
| Player | CAR | YDS | AVG | TD | LONG |
| Breece Hall | 11 | 38 | 3.5 | 0 | 8 |
| Justin Fields | 4 | 22 | 5.5 | 0 | 7 |
| Tyrod Taylor | 3 | 11 | 3.7 | 0 | 5 |
| Isaiah Davis | 2 | 10 | 5.0 | 0 | 5 |
| Team | 20 | 81 | 4.1 | 0 | 8 |
The Jets averaged 4.1 yards per rushing attempt as a team, which was better than Carolina’s 3.5-yard average.
That is an important reminder that the final score cannot always be explained by yards per play alone.
New York actually had the better rushing average, but Carolina had significantly more rushing volume and a much stronger defensive performance.
Tyler Johnson Led the Jets in Receiving Yards
Tyler Johnson was New York’s leading receiver by yardage.
He caught three passes for 60 yards, averaging 20.0 yards per reception.
His longest reception traveled 35 yards.
| Player | REC | YDS | AVG | TD | LONG | TGTS |
| Tyler Johnson | 3 | 60 | 20.0 | 0 | 35 | 3 |
| Mason Taylor | 3 | 31 | 10.3 | 0 | 13 | 5 |
| Josh Reynolds | 3 | 29 | 9.7 | 0 | 12 | 9 |
| Isaiah Davis | 2 | 22 | 11.0 | 0 | 12 | 4 |
| Allen Lazard | 2 | 16 | 8.0 | 0 | 9 | 3 |
| Breece Hall | 2 | 14 | 7.0 | 0 | 8 | 3 |
Johnson’s 60 yards came on only three receptions, making him the Jets’ most efficient big-play receiver by average.
However, the lack of a touchdown limited the impact of those plays.
This is one of the central themes of the game: New York could produce chunks of yardage, but Carolina consistently prevented those gains from becoming scoring drives.
Carolina’s Defense Created the Game’s Biggest Statistical Advantage
The Panthers recorded six sacks, three tackles for loss, nine passes defended, and 11 quarterback hits.
They also intercepted Tyrod Taylor twice.
| Defensive Category | Carolina | New York |
| Total Tackles | 60 | 75 |
| Solo Tackles | 32 | 44 |
| Sacks | 6 | 2 |
| Tackles for Loss | 3 | 6 |
| Passes Defended | 9 | 7 |
| QB Hits | 11 | 7 |
| Interceptions | 2 | 0 |
The six-sack total is arguably the clearest defensive statistic in the game.
New York allowed six sacks while Carolina allowed only two.
That created a substantial difference in how often each offense was forced behind schedule.
Pressure also affected Taylor’s ability to establish consistent rhythm.
Even when New York generated positive plays through its receivers, Carolina’s pass rush repeatedly interrupted drives.
Derrick Brown’s Defensive Impact
Derrick Brown led the Panthers’ defensive front with seven total tackles, four solo tackles, two sacks, and three quarterback hits.
| Statistic | Derrick Brown |
| Total Tackles | 7 |
| Solo Tackles | 4 |
| Sacks | 2 |
| Tackles for Loss | 0 |
| Pass Deflections | 3 |
| QB Hits | 3 |
Two sacks and three quarterback hits made Brown one of Carolina’s most disruptive defenders.
The combination of sacks and quarterback hits is particularly useful when analyzing a defensive line because it captures pressure that does not necessarily end in a sack.
Jaycee Horn Produced Two Interceptions
Jaycee Horn recorded two interceptions for Carolina.
Neither interception resulted in return yardage or a defensive touchdown, but the turnovers were still critical.
New York finished the game with two interceptions and no passing touchdowns.
Carolina, by contrast, had zero interceptions thrown.
That turnover differential helped the Panthers maintain control of a game in which neither offense produced a large amount of scoring.
Christian Rozeboom Also Finished With Seven Tackles
Christian Rozeboom recorded seven total tackles, including two solo tackles.
While he did not register a sack or interception, his tackle production helped Carolina limit New York’s rushing and short-area offensive plays.
His seven tackles tied Derrick Brown for the Panthers’ team lead in total tackles.
Jamien Sherwood Led New York’s Defense
Jamien Sherwood recorded 10 total tackles, including seven solo tackles.
He also added one sack, two tackles for loss, one pass deflection, and two quarterback hits.
| Statistic | Jamien Sherwood |
| Total Tackles | 10 |
| Solo Tackles | 7 |
| Sacks | 1 |
| Tackles for Loss | 2 |
| Pass Deflections | 1 |
| QB Hits | 2 |
Sherwood’s 10 tackles were the highest individual tackle total in the game.
His numbers demonstrate that New York’s defense was active, even though the Jets ultimately gave up 13 points and failed to force an interception.
Quinnen Williams Added Eight Tackles
Quinnen Williams finished with eight total tackles and four solo tackles.
He also recorded one tackle for loss.
His performance was another indication that the Jets’ defense was involved throughout the contest.
However, the difference was that Carolina managed to produce enough scoring opportunities while New York’s offense struggled to finish drives.
Special Teams Played a Major Role
Special teams rarely receives as much attention as quarterback or skill-position statistics, but this game provides a good example of why field position matters.
Carolina’s Ryan Fitzgerald converted both of his field-goal attempts and added an extra point.
He finished with seven points.
New York’s Nick Folk also converted both field-goal attempts, including a 47-yard field goal, and scored six points.
| Kicker | FG | FG % | XP | Points | Long FG |
| Ryan Fitzgerald | 2/2 | 100% | 1/1 | 7 | 30 |
| Nick Folk | 2/2 | 100% | 0/0 | 6 | 47 |
Because Carolina scored one touchdown while New York scored none, the field goals alone were not enough for the Jets to close the scoring gap.
Punting Numbers Show the Field Position Battle
Sam Martin punted six times for Carolina for 276 yards.
His average was 46.0 yards, with four punts landing inside the 20-yard line.
Austin McNamara punted five times for New York for 243 yards, averaging 48.6 yards.
Two of his punts landed inside the 20.
| Punter | Punts | Yards | Average | Inside 20 | Long |
| Sam Martin | 6 | 276 | 46.0 | 4 | 68 |
| Austin McNamara | 5 | 243 | 48.6 | 2 | 56 |
McNamara had the higher gross average, but Martin placed more punts inside the 20.
That distinction is valuable because gross distance and field-position effectiveness are not always the same thing.
Carolina’s Return Game
Trevor Etienne handled Carolina’s kick and punt return duties.
He recorded one kick return for 45 yards.
On punt returns, he recorded three returns for 35 yards, averaging 11.7 yards per return.
His longest punt return was 15 yards.
New York’s Isaiah Williams recorded three kick returns for 71 yards and two punt returns for 14 yards.
Kene Nwangwu added one kick return for 29 yards.
The Jets finished with 100 kick-return yards on four returns.
Why the Final Score Was So Low
The 13-6 score reflects a game in which both offenses struggled to convert possessions into touchdowns.
Carolina scored one touchdown and two field goals.
New York scored two field goals.
The most obvious reasons were:
- Carolina’s six sacks disrupted New York’s passing game.
- Jaycee Horn’s two interceptions created additional defensive stops.
- New York failed to throw a touchdown.
- Carolina protected the football through the air.
- The Panthers produced 125 rushing yards and maintained offensive balance.
- Both teams relied heavily on field goals rather than red-zone touchdowns.
The Jets actually finished with 172 receiving yards according to the supplied team statistics, compared with Carolina’s 198.
That difference is relatively small.
The much larger difference came through quarterback efficiency, sacks, turnovers, and touchdowns.
The Most Important Statistical Matchups
When examining carolina panthers vs new york jets match player stats, it helps to focus on the matchups that directly affected the scoreboard rather than simply identifying the players with the largest totals.
Panthers Passing vs Jets Pass Defense
Carolina’s quarterbacks combined for 177 passing yards and one touchdown.
New York’s defense recorded two sacks and seven passes defended.
The Jets kept the passing game from becoming explosive for most of the afternoon, but they did not create a turnover through the air.
Jets Passing vs Panthers Pass Rush
This was the most decisive statistical battle.
New York finished with 139 passing yards, two interceptions, and six sacks allowed.
Carolina recorded 11 quarterback hits.
The Panthers’ ability to pressure the quarterback changed the structure of the game.
Carolina Rushing vs New York Front Seven
Carolina produced 125 rushing yards on 36 attempts.
Dowdle was the primary producer, with 79 yards.
Hubbard added 31 yards.
New York recorded six tackles for loss, showing that the Jets did make plays behind the line of scrimmage.
However, Carolina’s overall rushing volume helped keep the offense functional.
Jets Rushing vs Carolina Defense
The Jets averaged 4.1 yards per carry, slightly better than Carolina’s 3.5.
Breece Hall led New York with 38 yards.
Despite that efficiency, New York did not record a rushing touchdown.
The absence of touchdowns was more important than the modest advantage in rushing efficiency.
What the Box Score Says About Offensive Efficiency
A common mistake when analyzing an NFL game is to assume the team with more yards necessarily controlled the game.
This matchup shows why that approach can be misleading.
Carolina had:
- 177 passing yards
- 125 rushing yards
- 302 combined offensive yards
- 1 passing touchdown
- 0 interceptions thrown
New York had:
- 139 passing yards
- 81 rushing yards
- 220 combined offensive yards
- 0 passing touchdowns
- 2 interceptions thrown
The Panthers therefore generated 82 more combined offensive yards.
More importantly, they converted those possessions into 13 points while New York converted its opportunities into only six.
The difference was not simply volume.
It was the quality of possessions.
Why Turnovers Mattered More Than Raw Yardage
Carolina’s defense intercepted Taylor twice.
New York did not intercept Young or Dalton.
That is a major distinction in a six-point game.
When the final margin is seven points, every turnover has greater practical importance because a single lost possession can represent a potential scoring opportunity for both teams.
Carolina avoided the most damaging form of passing mistake.
New York did not.
That helped the Panthers win despite not producing a dominant offensive statistical performance.
The Role of Field Goals in the Final Result
Both kickers were perfect on their field-goal attempts.
Fitzgerald made two kicks.
Folk also made two.
The difference came from touchdowns.
Carolina scored one touchdown through the passing game.
New York scored none.
That meant Carolina’s seven points from its touchdown plus six points from field goals produced 13 total points.
New York’s two field goals accounted for all six of its points.
This is a simple scoring breakdown, but it explains the final margin better than looking at total yardage alone.
Carolina’s Receiving Distribution
The Panthers completed 19 passes to six primary receiving contributors plus Tommy Tremble.
Legette accounted for nine of those receptions.
That means nearly half of Carolina’s completions went to one player.
The receiving distribution was:
- Xavier Legette: 9 receptions, 92 yards, 1 touchdown
- Tetairoa McMillan: 3 receptions, 33 yards
- Chuba Hubbard: 2 receptions, 24 yards
- Mitchell Evans: 2 receptions, 24 yards
- Rico Dowdle: 1 reception, 17 yards
- Jimmy Horn Jr.: 1 reception, 8 yards
- Tommy Tremble: 1 reception, 0 yards
The data indicates that Carolina’s passing game was concentrated around Legette, while its other targets played supporting roles.
New York’s Receiving Distribution
The Jets had a somewhat more distributed receiving workload.
Tyler Johnson led the team with 60 yards.
Mason Taylor and Josh Reynolds each caught three passes.
Josh Reynolds received nine targets, the highest target total among the listed Jets receivers, but finished with 29 yards.
That gap between targets and production is worth noting.
Target volume tells us how frequently a player was involved in the passing plan. It does not automatically translate into receiving yardage.
A Closer Look at Quarterback Efficiency
The quarterback numbers reveal a major difference between the teams.
Carolina’s combined passing line:
19 completions on 32 attempts, 177 yards, one touchdown, zero interceptions.
New York’s combined passing line:
16 completions on 34 attempts, 139 yards, zero touchdowns, two interceptions.
Carolina therefore attempted fewer passes but produced more yards and a touchdown.
New York attempted two additional passes but generated 38 fewer passing yards.
That works out to a major difference in yards per attempt:
Carolina: 6.2
New York: 5.1
The Panthers were more productive on a per-attempt basis while also avoiding interceptions.
Defensive Pressure Was the Defining Difference
The most striking contrast is the sack count.
Carolina: 6 sacks
New York: 2 sacks
The four-sack difference is substantial.
Carolina also generated 11 quarterback hits.
New York generated seven.
Pressure can affect an offense even when it does not result in an immediate turnover. It can shorten the quarterback’s decision window, disrupt timing, force throws away, and prevent deeper route development.
The box score does not capture every one of those effects, but the sack and quarterback-hit numbers provide strong evidence that Carolina’s defense consistently challenged New York’s passing game.
What the Game Reveals About the Panthers
The Panthers’ 13-6 victory moved them to 4-3 after seven games.
The result demonstrated a formula based on several components rather than one spectacular offensive performance.
Carolina:
- Ran 36 times.
- Passed 32 times.
- Produced 302 combined offensive yards.
- Scored one passing touchdown.
- Avoided interceptions.
- Recorded six sacks.
- Intercepted the Jets twice.
- Made both field-goal attempts.
That combination allowed the Panthers to win a game in which the offense was productive but not explosive.
What the Game Reveals About the Jets
The Jets dropped to 0-7 after the loss.
Their statistical profile showed several positive elements, including 4.1 yards per rushing attempt and 172 receiving yards.
However, those numbers did not produce enough points.
The biggest offensive problems were:
- 139 passing yards
- Zero passing touchdowns
- Two interceptions
- Six sacks allowed
- 81 rushing yards
- Zero rushing touchdowns
The Jets also failed to force a turnover.
That combination made it difficult to overcome Carolina’s defensive pressure.
Player Stat Summary
For readers who want the most important numbers in one place, the following summary captures the primary contributors.
Carolina Panthers
| Player | Category | Production |
| Bryce Young | Passing | 15/25, 138 YDS, 1 TD, 0 INT |
| Andy Dalton | Passing | 4/7, 60 YDS, 0 TD, 0 INT |
| Rico Dowdle | Rushing | 17 CAR, 79 YDS, 4.6 AVG |
| Chuba Hubbard | Rushing | 14 CAR, 31 YDS, 2.2 AVG |
| Xavier Legette | Receiving | 9 REC, 92 YDS, 1 TD |
| Tetairoa McMillan | Receiving | 3 REC, 33 YDS |
| Derrick Brown | Defense | 7 TOT, 2 SACKS, 3 QB HITS |
| Jaycee Horn | Defense | 2 INT |
| Ryan Fitzgerald | Kicking | 2/2 FG, 1/1 XP, 7 PTS |
New York Jets
| Player | Category | Production |
| Tyrod Taylor | Passing | 10/22, 126 YDS, 0 TD, 2 INT |
| Justin Fields | Passing | 6/12, 46 YDS, 0 TD, 0 INT |
| Breece Hall | Rushing | 11 CAR, 38 YDS, 3.5 AVG |
| Tyler Johnson | Receiving | 3 REC, 60 YDS |
| Mason Taylor | Receiving | 3 REC, 31 YDS |
| Josh Reynolds | Receiving | 3 REC, 29 YDS |
| Jamien Sherwood | Defense | 10 TOT, 1 SACK, 2 TFL |
| Quinnen Williams | Defense | 8 TOT, 1 TFL |
| Nick Folk | Kicking | 2/2 FG, 6 PTS |
How to Read These Player Stats Correctly
A useful way to analyze an NFL box score is to separate production into four questions:
1. Who created yardage?
For Carolina, Legette and Dowdle were the primary answers.
For New York, Johnson and Hall led their respective categories.
2. Who created scoring?
Legette caught Carolina’s only passing touchdown.
Neither Jets quarterback threw a touchdown.
3. Who protected possessions?
Carolina’s quarterbacks threw zero interceptions.
New York threw two.
4. Who changed the quarterback’s environment?
Carolina’s defense produced six sacks and 11 quarterback hits.
New York recorded two sacks and seven quarterback hits.
This framework gives much more context than simply looking at the highest yardage totals.
Why This Was a Defensive Game
The 19 total combined points were the product of several defensive and situational factors.
Carolina’s defense prevented the Jets from scoring a touchdown.
New York’s defense also held the Panthers to only 13 points.
The difference was that Carolina found one touchdown opportunity and successfully converted both of its field-goal attempts.
The Panthers also created two interceptions.
This made the game a classic example of how an NFL team can win without producing an explosive offensive performance.
Historical Context for the Matchup
The October 19 meeting was a Week 7 game in the 2025 NFL regular season.
NFL’s official schedule records the result as Carolina 13, New York 6, with Carolina improving to 4-3 and New York falling to 0-7 after the matchup.
For statistical analysis, the game is most useful as a snapshot of what happened on that specific Sunday rather than as a complete assessment of either team’s entire season.
One game can reveal tactical strengths and weaknesses, but it should not be treated as proof that a player’s overall ability has permanently changed.
Frequently Asked Questions
Who won the Panthers vs Jets game on October 19, 2025?
The Carolina Panthers defeated the New York Jets 13-6 at MetLife Stadium.
Who was Carolina’s leading receiver?
Xavier Legette led Carolina with nine receptions for 92 yards and one touchdown on 11 targets.
Who led the Panthers in rushing?
Rico Dowdle led Carolina with 17 carries for 79 yards, averaging 4.6 yards per carry.
How many interceptions did the Panthers record?
Carolina recorded two interceptions, both credited to Jaycee Horn.
How many sacks did Carolina record?
The Panthers recorded six sacks and 11 quarterback hits.
How did Tyrod Taylor perform?
Taylor completed 10 of 22 passes for 126 yards, with no touchdowns and two interceptions. He was also sacked three times.
Did Bryce Young finish the game?
No. Young left the game with an ankle injury, and Andy Dalton took over. NFL reporting confirmed that Young did not return after leaving the second half.
Conclusion
The carolina panthers vs new york jets match player stats show a game decided more by defensive execution and possession quality than by overwhelming offensive production.
Carolina finished with 302 combined offensive yards, including 177 through the air and 125 on the ground. The Panthers protected the football through the passing game, received 92 yards and a touchdown from Xavier Legette, and got 79 rushing yards from Rico Dowdle.
The defense supplied the most decisive statistical advantage. Carolina recorded six sacks, 11 quarterback hits, and two interceptions. Derrick Brown produced two sacks, while Jaycee Horn intercepted Tyrod Taylor twice.
New York’s offense generated 220 combined yards, including 139 passing yards and 81 rushing yards. Tyler Johnson produced 60 receiving yards, Breece Hall led the rushing attack with 38 yards, and Jamien Sherwood led all players with 10 total tackles. Yet the Jets could not turn their yardage into touchdowns.
The quarterback comparison also explains much of the result. Carolina’s quarterbacks combined for 177 passing yards, one touchdown, and no interceptions. New York’s quarterbacks combined for 139 yards, no touchdowns, and two interceptions.
Ultimately, the 13-6 final score was consistent with the statistical story. Carolina did not need a huge offensive performance because its defense consistently created pressure, forced turnovers, and prevented New York from reaching the end zone.
For anyone researching carolina panthers vs new york jets match player stats, the most important numbers are therefore not simply the leading yardage totals. The complete picture comes from combining passing efficiency, rushing volume, receiving production, turnovers, sacks, quarterback pressure, and scoring efficiency.





One Comment