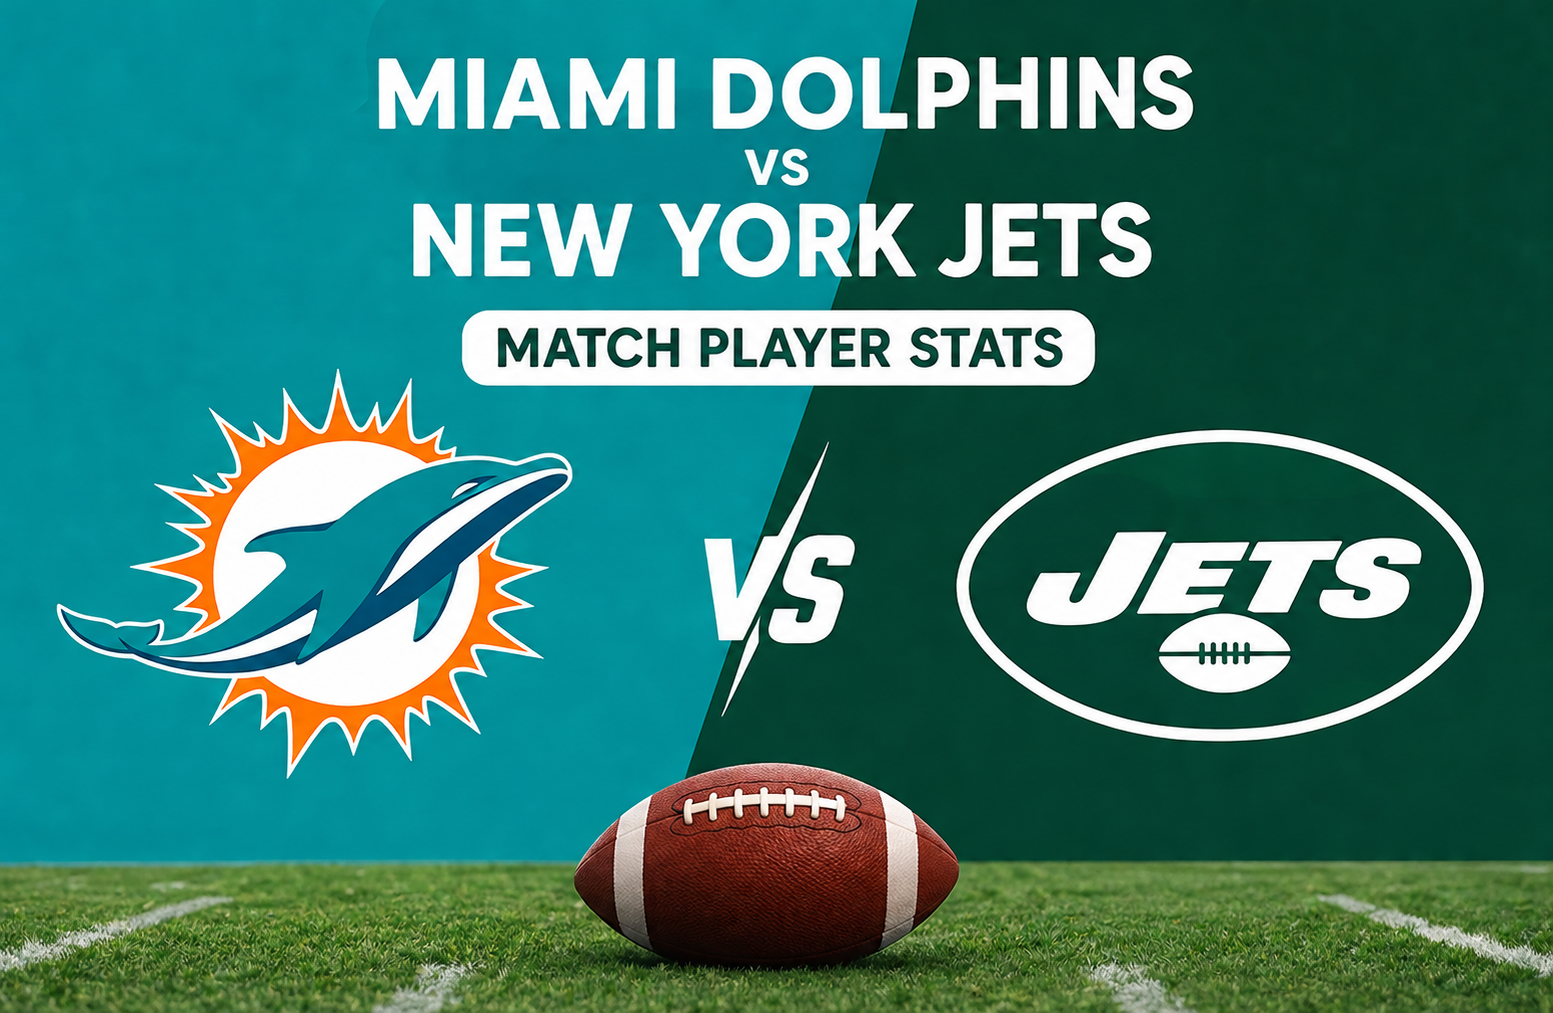
Miami Dolphins vs New York Jets Match Player Stats
The Miami Dolphins vs New York Jets Match Player Stats from September 29, 2025, tell the story of a competitive AFC East matchup in which Miami defeated New York 27-21. While the final score was relatively close, the individual statistics reveal a much more detailed picture of how Miami overcame a strong Jets rushing attack and how turnovers became one of the biggest deciding factors.
The Dolphins entered the game needing a positive result and improved their record to 1-3, including a 1-1 record at home. The Jets fell to 0-4 and remained winless away from home at 0-2. Both teams produced impressive individual performances, particularly at quarterback and running back, but Miami made better use of its scoring opportunities.
Justin Fields delivered one of the strongest statistical performances for New York, passing efficiently and leading the team in rushing. Tua Tagovailoa was also highly effective, throwing two touchdown passes without taking a sack. De’Von Achane provided balance on the ground, while Darren Waller’s two touchdown receptions proved extremely valuable for Miami.
This detailed breakdown examines the complete Miami Dolphins vs New York Jets Match Player Stats, including passing, rushing, receiving, defense, special teams, turnovers, and the performances that had the greatest influence on the final result.
Game Overview
| Category | Result |
| Matchup | Miami Dolphins vs New York Jets |
| Date | September 29, 2025 |
| Final Score | Miami Dolphins 27, New York Jets 21 |
| Winner | Miami Dolphins |
| Jets Record After Game | 0-4 |
| Dolphins Record After Game | 1-3 |
| Jets Away Record | 0-2 |
| Dolphins Home Record | 1-1 |
Miami won by six points, but the game featured several moments where New York appeared capable of taking control. The Jets produced 197 rushing yards and received a highly productive dual-threat performance from Justin Fields.
However, football games are rarely decided by one statistical category alone.
New York’s biggest problem was ball security. The Jets lost all three of their fumbles. Miami, meanwhile, recorded two fumbles but lost none. That difference created a major advantage for the Dolphins and demonstrates why total yardage alone does not always determine the winner.
Miami also received efficient quarterback play, strong red-zone production, and a defense led by an extraordinary tackling performance from Jordyn Brooks.
Quarter-by-Quarter Score Breakdown
The scoring progression helps explain how the contest developed.
| Quarter | New York Jets | Miami Dolphins |
| First Quarter | 0 | 3 |
| Second Quarter | 3 | 7 |
| Third Quarter | 7 | 14 |
| Fourth Quarter | 11 | 3 |
| Final Score | 21 | 27 |
Miami established an early advantage and produced its strongest offensive quarter during the third period, scoring 14 points.
The Jets fought back in the fourth quarter with 11 points, but Miami’s earlier scoring success created enough separation to protect the lead.
This was an important pattern in the game. Miami did not need to dominate every quarter. Instead, the Dolphins built their advantage during the middle stages and then survived New York’s late push.
Miami Dolphins vs New York Jets Match Player Stats: Passing
Quarterback efficiency was one of the most interesting aspects of this matchup.
Both starting quarterbacks avoided interceptions. Both also threw touchdown passes. However, their performances were different in style.
Justin Fields Passing Statistics
| Statistic | Justin Fields |
| Completions/Attempts | 20/27 |
| Passing Yards | 226 |
| Average | 8.4 |
| Passing Touchdowns | 1 |
| Interceptions | 0 |
| Sacks | 2 |
| Sack Yards Lost | 19 |
| QBR | 80.6 |
| Passer Rating | 111.0 |
Justin Fields completed 20 of 27 passes for 226 yards and one touchdown.
His completion percentage and yards-per-attempt figure showed that New York’s passing game was efficient. An average of 8.4 yards per attempt is particularly notable because it suggests the Jets were not relying entirely on short, conservative throws.
Fields also avoided interceptions, which normally gives an offense a strong foundation.
What made his performance even more impressive was his contribution as a runner. Fields became New York’s leading rusher with 81 yards and a touchdown.
From an individual perspective, Fields produced one of the most complete performances of the game.
The challenge for New York was that strong quarterback production did not overcome the team’s three lost fumbles.
Tua Tagovailoa Passing Statistics
| Statistic | Tua Tagovailoa |
| Completions/Attempts | 17/25 |
| Passing Yards | 177 |
| Average | 7.1 |
| Passing Touchdowns | 2 |
| Interceptions | 0 |
| Sacks | 0 |
| QBR | 56.6 |
| Passer Rating | 114.9 |
Tua Tagovailoa completed 17 of 25 passes for 177 yards and two touchdowns.
His passing yardage was lower than Fields’ total, but Miami received excellent efficiency where it mattered most. Tagovailoa threw two touchdown passes and did not turn the football over.
One of the most important details was the fact that he was not sacked.
A quarterback who avoids sacks gives his offense several advantages:
- Drives remain on schedule
- The offense avoids negative yardage
- Passing situations remain manageable
- The quarterback has more opportunities to operate efficiently
Tagovailoa’s 114.9 passer rating was also higher than Fields’ 111.0 rating.
The difference was small, but Miami’s quarterback converted his efficiency into two touchdown passes, helping the Dolphins produce enough points to win.
Quarterback Comparison
| Category | Justin Fields | Tua Tagovailoa |
| Completions/Attempts | 20/27 | 17/25 |
| Passing Yards | 226 | 177 |
| Passing TDs | 1 | 2 |
| Interceptions | 0 | 0 |
| Sacks | 2 | 0 |
| QBR | 80.6 | 56.6 |
| Passer Rating | 111.0 | 114.9 |
Fields generated more passing yards and added significant value as a runner.
Tagovailoa generated fewer yards but threw more touchdown passes and remained completely untouched in the sack column.
This is a useful reminder when analyzing player statistics: more passing yards do not automatically mean a better result. Touchdowns, turnovers, sacks, field position, and offensive balance all matter.
Rushing Statistics
The rushing battle was fascinating because New York actually produced more team rushing yards than Miami.
New York Jets Rushing Stats
| Player | Carries | Yards | Average | TD | Long |
| Justin Fields | 7 | 81 | 11.6 | 1 | 43 |
| Breece Hall | 14 | 81 | 5.8 | 0 | 23 |
| Braelon Allen | 4 | 26 | 6.5 | 0 | 15 |
| Isaiah Davis | 3 | 9 | 3.0 | 0 | 6 |
| Team Total | 28 | 197 | 7.0 | 1 | 43 |
The Jets averaged an outstanding 7.0 yards per rushing attempt.
Justin Fields and Breece Hall each produced 81 rushing yards, creating a balanced and dangerous ground attack.
Fields’ 43-yard longest run showed his ability to create explosive plays with his mobility. Hall averaged 5.8 yards per carry across 14 attempts, providing consistent production.
On most days, nearly 200 rushing yards would give an NFL team an excellent opportunity to win.
That makes New York’s loss particularly interesting from an analytical perspective.
The Jets were highly productive on the ground, but production was undermined by turnovers.
Miami Dolphins Rushing Stats
| Player | Carries | Yards | Average | TD | Long |
| De’Von Achane | 20 | 99 | 5.0 | 1 | 21 |
| Ollie Gordon II | 6 | 10 | 1.7 | 0 | 7 |
| Malik Washington | 2 | 8 | 4.0 | 0 | 8 |
| Tua Tagovailoa | 3 | 6 | 2.0 | 0 | 5 |
| Team Total | 31 | 123 | 4.0 | 1 | 21 |
De’Von Achane was clearly the centerpiece of Miami’s rushing attack.
He carried the ball 20 times for 99 yards and one touchdown, averaging 5.0 yards per carry.
Achane’s performance was important because it gave Miami a reliable offensive foundation. While the Jets produced more total rushing yards, Miami had a running back capable of handling a large workload and consistently moving the offense forward.
Twenty carries also demonstrate how heavily Miami relied on Achane to maintain offensive balance.
Why Miami’s Ground Game Still Mattered
Miami did not need to win the rushing-yard battle to win the game.
The Dolphins needed enough rushing production to prevent the offense from becoming predictable.
Achane accomplished exactly that.
His 99 yards helped Miami maintain offensive balance, control possessions, and support Tagovailoa’s passing game.
The difference between the teams was not simply rushing production. It was how efficiently each team converted its overall opportunities into points while protecting the football.
Receiving Statistics
The receiving statistics show different offensive approaches from both teams.
New York had more passing yards, while Miami generated the more valuable touchdown production.
New York Jets Receiving Leaders
| Player | Receptions | Yards | Average | TD | Long | Targets |
| Garrett Wilson | 6 | 82 | 13.7 | 1 | 23 | 8 |
| Mason Taylor | 5 | 65 | 13.0 | 0 | 27 | 7 |
| Breece Hall | 5 | 30 | 6.0 | 0 | 8 | 6 |
| Jeremy Ruckert | 1 | 23 | 23.0 | 0 | 12 | 1 |
| Isaiah Davis | 2 | 18 | 9.0 | 0 | 14 | 2 |
| Allen Lazard | 1 | 8 | 8.0 | 0 | 8 | 1 |
| Josh Reynolds | 0 | 0 | 0 | 0 | 0 | 2 |
Garrett Wilson Leads the Jets
Garrett Wilson finished as New York’s leading receiver with six catches for 82 yards and one touchdown.
His 13.7 yards per reception showed that he was able to create meaningful gains rather than simply collecting short receptions.
Wilson’s touchdown also represented the Jets’ only receiving touchdown of the game.
Mason Taylor Provides Strong Support
Mason Taylor caught five passes for 65 yards.
His 13.0-yard average made him another effective option in the passing game. With five receptions on seven targets, Taylor provided Fields with a dependable target.
Breece Hall’s Dual-Threat Contribution
Hall was productive both as a runner and receiver.
He recorded:
- 81 rushing yards
- 30 receiving yards
- Five receptions
That gave him 111 yards from scrimmage.
His versatility helped New York create offensive flexibility, but the team still could not overcome its turnover problems.
Miami Dolphins Receiving Leaders
| Player | Receptions | Yards | Average | TD | Long | Targets |
| Tyreek Hill | 6 | 67 | 11.2 | 0 | 28 | 6 |
| Jaylen Waddle | 3 | 48 | 16.0 | 0 | 25 | 6 |
| Darren Waller | 3 | 27 | 9.0 | 2 | 14 | 4 |
| Julian Hill | 1 | 19 | 19.0 | 0 | 19 | 2 |
| Malik Washington | 2 | 13 | 6.5 | 0 | 9 | 3 |
| De’Von Achane | 1 | 2 | 2.0 | 0 | 2 | 2 |
| Nick Westbrook-Ikhine | 1 | 1 | 1.0 | 0 | 1 | 1 |
| Ollie Gordon II | 0 | 0 | 0 | 0 | 0 | 1 |
Tyreek Hill Led Miami in Receiving Yards
Tyreek Hill finished with six receptions for 67 yards.
Interestingly, Hill received exactly six targets and made six catches. That represents perfect catch efficiency based on the target numbers provided.
He did not score a touchdown, but his reliability helped Miami move the ball through the air.
His longest reception went for 28 yards, demonstrating his ability to generate meaningful gains.
Jaylen Waddle Creates Big-Play Value
Jaylen Waddle caught three passes for 48 yards.
His average of 16.0 yards per reception was the highest among Miami’s receivers with multiple catches.
Waddle’s numbers show how a player can have a significant impact without needing a huge reception total. Three catches can still be extremely valuable when they consistently create substantial yardage.
Darren Waller’s Two Touchdowns
Darren Waller produced arguably the most important receiving performance for Miami.
He caught:
- Three passes
- 27 yards
- Two touchdowns
His yardage total was modest compared with some other receivers, but his touchdowns made his contribution far more valuable.
This is one of the clearest examples from the game of why raw yardage should never be the only statistic used to judge a player’s impact.
A receiver with 100 yards and no touchdowns may have an excellent game. However, a player who catches two touchdown passes can directly influence the scoreboard in a way that ordinary yardage cannot.
Waller’s two scores were central to Miami’s offensive success.
The Turnover Battle That Changed the Game
The most important team statistic from this matchup may have been the fumble numbers.
| Team | Total Fumbles | Fumbles Lost |
| New York Jets | 3 | 3 |
| Miami Dolphins | 2 | 0 |
New York lost all three of its fumbles.
Miami lost none.
That difference was enormous.
The Jets had strong numbers in several major categories:
- 226 passing yards
- 197 rushing yards
- 7.0 yards per rushing attempt
- Efficient quarterback play
- No interceptions thrown
Yet New York still lost.
The reason is simple: turnovers can erase otherwise successful offensive production.
Every lost fumble can end a drive, surrender possession, change field position, and create scoring opportunities for the opponent.
This game provides a strong example of a fundamental football principle:
Ball security can be more valuable than impressive yardage totals.
Miami made mistakes too, recording two fumbles. But the Dolphins recovered both and avoided losing possession.
That difference allowed Miami to survive errors while New York paid the full price for its mistakes.
Defensive Player Stats
Jordyn Brooks Delivers an Exceptional Performance
Jordyn Brooks led Miami with 18 total tackles.
That was the standout defensive individual statistic of the game.
Eighteen tackles represent an extremely high level of involvement. Brooks was repeatedly around the football and played a major role in limiting New York’s offensive possessions.
The Jets produced nearly 200 rushing yards, so Miami’s defense faced a difficult challenge. Brooks’ tackling production reflects how frequently the defense had to respond to New York’s productive running game.
His performance was one of the clearest examples of defensive workload and consistency in the matchup.
Jamien Sherwood Leads the Jets
Jamien Sherwood led New York with 10 total tackles.
Sherwood’s performance made him the Jets’ leading tackler and showed his importance to the defense.
However, Miami’s offense found enough scoring success to finish with 27 points.
Team Sack Comparison
| Team | Sacks |
| Miami Dolphins | 2 |
| New York Jets | 0 |
Miami’s pass rush produced two sacks.
The Jets did not record a sack against Tagovailoa.
This was an important difference because Miami’s quarterback was able to operate without losing passing plays to sacks.
Pass protection often receives less attention than passing yards or touchdowns, but it can dramatically influence a game.
Miami’s offensive line gave Tagovailoa a clean enough environment to distribute the ball efficiently and throw two touchdown passes.
No Interceptions in the Game
Neither team recorded an interception.
That means the turnover battle was entirely dominated by fumbles.
For New York, this makes the three lost fumbles even more frustrating because Fields otherwise protected the football well as a passer.
He threw zero interceptions and completed 20 passes.
Miami also avoided interceptions, allowing Tagovailoa to finish with a clean passing line.
The difference was that Miami also avoided losing its fumbles.
Special Teams Statistics
Special teams often decide field position, and several individual performances stood out.
Kick Returns
Isaiah Davis for the Jets
Isaiah Davis recorded:
- Three kick returns
- 108 yards
- 36.0-yard average
- Long return of 41 yards
A 36-yard average gave the Jets strong field-position potential.
Malik Washington for Miami
Malik Washington recorded:
- Three kick returns
- 96 yards
- 32.0-yard average
- Long return of 34 yards
Washington also gave Miami dependable return production.
Punt Returns
Isaiah Williams returned one punt for 18 yards for the Jets.
Miami did not record any punt returns.
Kicking Statistics
Nick Folk
| Statistic | Result |
| Field Goals | 2/2 |
| Field Goal Percentage | 100% |
| Longest Field Goal | 58 yards |
| Extra Points | 1/1 |
| Total Points | 7 |
Nick Folk was perfect on his field-goal attempts and connected on a long 58-yard kick.
A successful field goal from that distance is a significant contribution because long-range attempts can be difficult and can influence late-game strategy.
Riley Patterson
| Statistic | Result |
| Field Goals | 2/2 |
| Field Goal Percentage | 100% |
| Longest Field Goal | 47 yards |
| Extra Points | 3/3 |
| Total Points | 9 |
Riley Patterson was also perfect.
He made both field-goal attempts and all three extra points, finishing with nine points.
That was a valuable contribution in a game decided by six points.
Punting Statistics
Austin McNamara
Austin McNamara recorded:
- Two punts
- 84 total yards
- 42.0-yard average
- One punt inside the 20
- Longest punt of 43 yards
Jake Bailey
Jake Bailey recorded:
- Four punts
- 192 total yards
- 48.0-yard average
- Three punts inside the 20
- Longest punt of 64 yards
Bailey’s performance was particularly important from a field-position perspective.
A 48.0-yard average and three punts inside the 20 gave Miami’s defense opportunities to force New York to work through longer fields.
Top Performers of the Game
Several players deserve recognition based on their statistical impact.
1. Justin Fields
Fields was arguably New York’s most complete offensive player.
His combined production included:
- 226 passing yards
- One passing touchdown
- 81 rushing yards
- One rushing touchdown
- Zero interceptions
He created plays through both the air and on the ground.
The loss should not overshadow the quality of his individual production.
2. Tua Tagovailoa
Tagovailoa produced an efficient winning performance.
His key numbers included:
- 17 completions
- 177 passing yards
- Two touchdowns
- Zero interceptions
- Zero sacks
He did not need enormous passing yardage because Miami found success through balance and scoring efficiency.
3. De’Von Achane
Achane carried Miami’s rushing attack with:
- 20 carries
- 99 yards
- 5.0 yards per carry
- One touchdown
His workload and efficiency gave the Dolphins a dependable offensive foundation.
4. Darren Waller
Waller’s two touchdown catches made him one of the game’s most important scoring threats.
His final line of three receptions for 27 yards does not immediately look spectacular, but two touchdowns dramatically increase the importance of his contribution.
5. Jordyn Brooks
Brooks led Miami with 18 total tackles.
His performance was one of the strongest defensive statistical displays in the game and reflected his importance against a Jets rushing attack that produced 197 yards.
6. Garrett Wilson
Wilson led New York’s receiving group with:
- Six catches
- 82 yards
- One touchdown
He remained Fields’ most productive receiving weapon and delivered both yardage and scoring value.
What the Statistics Reveal About Miami’s Victory
Looking only at the final score provides a basic understanding of the game.
Looking deeper at the player statistics explains why Miami won.
Miami Was More Efficient in Scoring Situations
Tagovailoa threw two touchdown passes.
Darren Waller caught both.
Miami converted offensive opportunities into touchdowns despite producing fewer passing yards than New York.
The Dolphins Protected the Football Better
This was arguably the biggest factor.
Miami:
- Fumbled twice
- Lost zero fumbles
New York:
- Fumbled three times
- Lost all three
A team can survive mistakes. It becomes much harder when every fumble results in lost possession.
Miami’s Passing Protection Was Excellent
Tagovailoa was not sacked.
Fields was sacked twice.
The difference helped Miami maintain offensive rhythm and avoid negative plays.
The Dolphins Found Balance
Miami received:
- 177 passing yards
- 123 rushing yards
- Two passing touchdowns
- One rushing touchdown
The offense did not rely completely on one player or one method of attack.
Achane handled the rushing workload, while Tagovailoa distributed passes to Hill, Waddle, Waller, and others.
What Went Wrong for the New York Jets?
The Jets produced enough offense to make this game competitive.
Their biggest problem was not a lack of talent or production.
It was the inability to protect the football.
Three Lost Fumbles
This was the defining negative statistic.
New York lost possession three times through fumbles.
Those turnovers reduced the value of the team’s otherwise impressive offensive production.
Strong Rushing Numbers Did Not Become Enough Points
The Jets rushed for 197 yards at an average of 7.0 yards per attempt.
Those numbers normally create a winning formula.
But rushing success must lead to sustained drives and points.
Turnovers interrupted that process.
The Jets Could Not Sack Tagovailoa
New York recorded zero sacks.
Miami’s quarterback had time to operate and avoided the negative plays that often destroy drives.
A Strong Fourth Quarter Was Not Enough
The Jets scored 11 points in the final quarter.
However, Miami had already built a 27-point total.
New York’s late scoring effort made the final score closer, but the earlier turnover damage proved too difficult to overcome.
Key Statistical Comparison
| Category | New York Jets | Miami Dolphins |
| Final Score | 21 | 27 |
| Passing Yards | 226 | 177 |
| Passing TDs | 1 | 2 |
| Interceptions Thrown | 0 | 0 |
| Rushing Yards | 197 | 123 |
| Rushing Average | 7.0 | 4.0 |
| Team Sacks | 0 | 2 |
| Fumbles | 3 | 2 |
| Fumbles Lost | 3 | 0 |
This table tells the complete story better than any single statistic.
New York won the passing-yard and rushing-yard comparisons.
Miami won the game.
Why?
Because football is ultimately decided by points, possessions, scoring efficiency, and mistakes.
The Dolphins protected the ball better and converted opportunities into touchdowns.
The Most Important Lessons From the Match
Yardage Is Not Everything
New York generated more yards through both passing and rushing.
Miami still won.
This demonstrates why evaluating a game requires more than comparing total offensive production.
Turnovers Can Reverse a Game
Three lost fumbles can destroy the value of hundreds of offensive yards.
New York’s performance is a clear example.
Touchdowns Matter More Than Empty Yardage
Darren Waller produced only 27 receiving yards, but his two touchdowns had enormous value.
Tagovailoa threw fewer yards than Fields but produced more passing touchdowns.
Balance Helps an Offense Stay Dangerous
Miami did not depend entirely on Tagovailoa or Achane.
The Dolphins mixed rushing attempts with contributions from multiple receivers.
That made the offense more difficult to predict.
Defensive Tackling Remains Crucial
Jordyn Brooks’ 18 tackles demonstrate how important consistent tackling can be against a productive running attack.
New York averaged 7.0 yards per rushing attempt, so Miami needed defenders who could repeatedly finish plays.
Why Fans Search for Miami Dolphins vs New York Jets Match Player Stats
Fans searching for detailed game statistics usually want more than the final score.
They often want to know:
- Which quarterback played better?
- Who led the game in rushing?
- Which receivers scored touchdowns?
- Who made the biggest defensive impact?
- How did turnovers affect the result?
- Which team had the better overall offensive production?
The Miami Dolphins vs New York Jets Match Player Stats answer these questions by showing that the winning team was not necessarily the team with the highest total production in every category.
New York had impressive offensive numbers.
Miami had the better overall game management.
That distinction is what makes player-stat analysis useful.
FAQs
Who won the Miami Dolphins vs New York Jets game on September 29, 2025?
The Miami Dolphins won the game 27-21 against the New York Jets.
Who was the leading passer in the game?
Justin Fields led all quarterbacks in passing yards with 226 yards for the Jets. Tua Tagovailoa threw for 177 yards and two touchdowns for Miami.
Who led the game in rushing yards?
Justin Fields and Breece Hall each recorded 81 rushing yards for the Jets, while De’Von Achane led Miami with 99 rushing yards.
Who scored the most receiving touchdowns?
Darren Waller scored two receiving touchdowns for the Miami Dolphins.
What was the biggest reason the Jets lost?
The Jets lost three fumbles and lost possession on all three. Miami had two fumbles but lost none.
Who was the leading tackler?
Jordyn Brooks led the Miami Dolphins with 18 total tackles. Jamien Sherwood led the Jets with 10 tackles.
Conclusion
The Miami Dolphins vs New York Jets Match Player Stats reveal a game that was far more competitive than a simple final-score summary might suggest.
The Jets produced excellent rushing numbers, with 197 yards on the ground and strong contributions from Justin Fields and Breece Hall. Fields also passed for 226 yards and added a rushing touchdown, making him one of the most productive individual players on the field.
Miami, however, found a more effective path to victory.
Tua Tagovailoa threw two touchdown passes without an interception or a sack. De’Von Achane delivered 99 rushing yards and a touchdown, while Darren Waller turned three receptions into two crucial touchdown catches. On defense, Jordyn Brooks produced an exceptional 18-tackle performance.
The decisive factor was ball security. New York lost all three of its fumbles, while Miami lost none of its two fumbles.
That single difference explains one of football’s most important truths: impressive statistics only matter when a team protects its possessions and converts opportunities into points.
Miami did exactly that and earned a 27-21 victory.


2 Comments