Knicks vs 76ers Match Player Stats
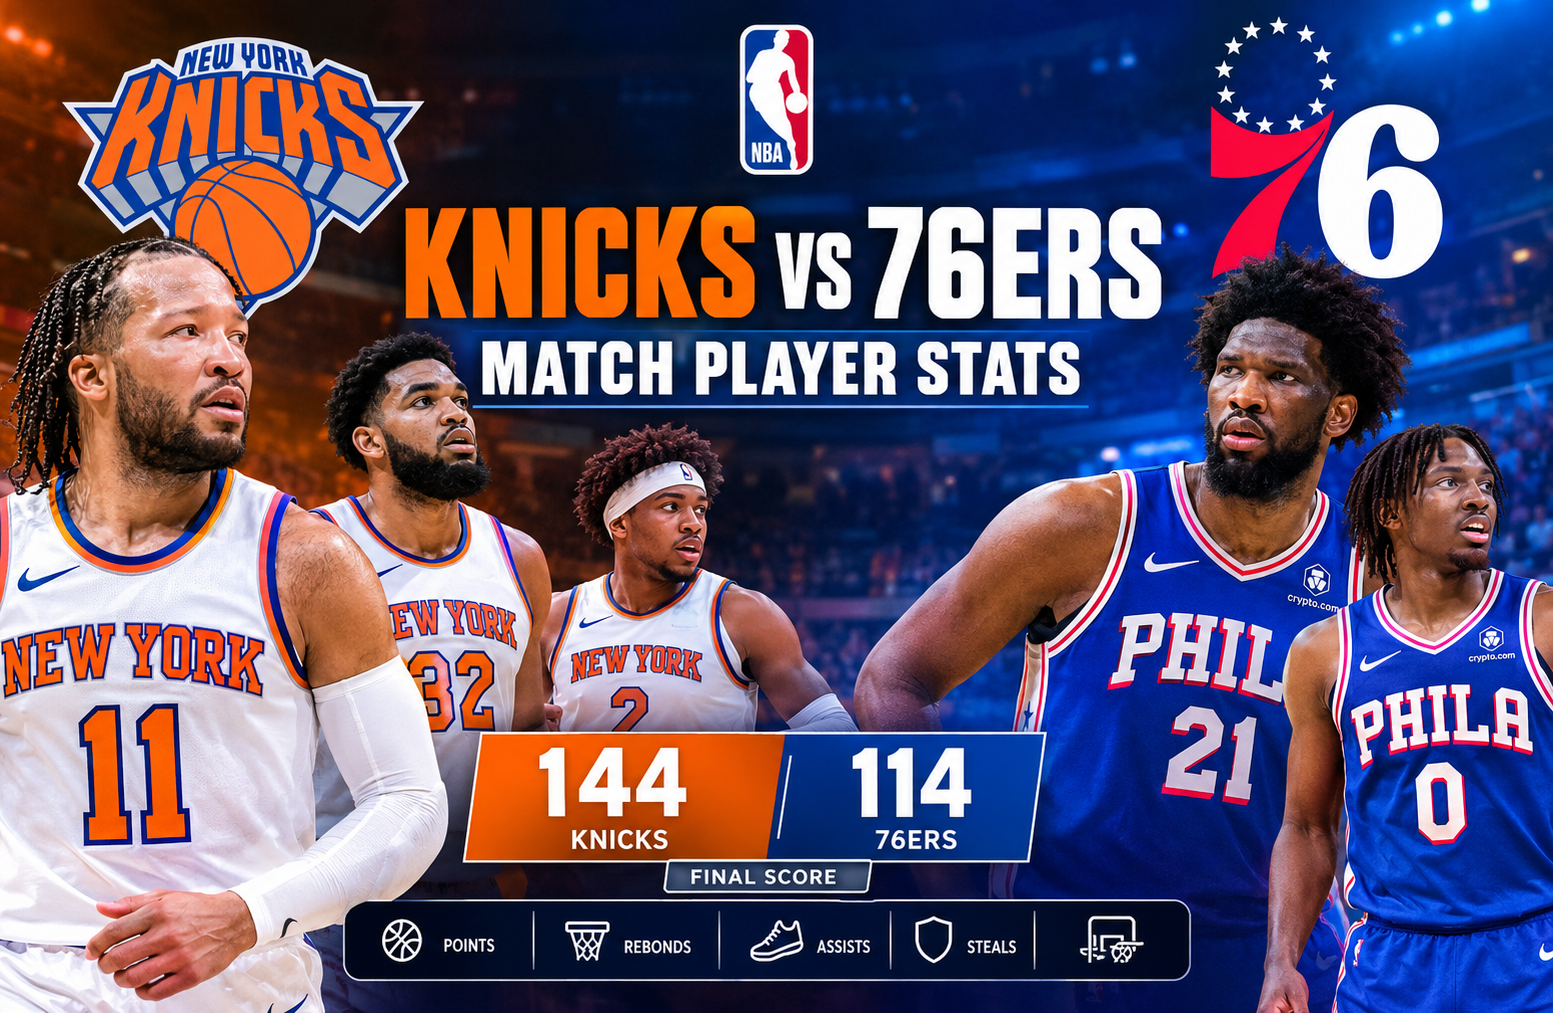
The knicks vs 76ers match player stats from Game 4 of the 2026 Eastern Conference Semifinals show how completely New York controlled the decisive game of the series. The Knicks defeated the Philadelphia 76ers 144-114, completed a 4-0 series sweep, and produced one of the most explosive three-point shooting performances of the postseason. Miles McBride led New York with 25 points, while Jalen Brunson added 22, and Karl-Anthony Towns finished with 17 points and 10 assists despite playing only 20 minutes.
The game was especially notable because New York did not rely on one player to carry the offense. Six Knicks reached double figures, the team made 25 of 44 three-point attempts, and New York built a 44-point lead before Philadelphia’s reserves reduced the final margin. The official NBA record confirms the 144-114 final score, the 19,746 attendance, and the 4-0 series result. (NBA)
For readers examining the box score beyond the final result, this game provides several useful details. Philadelphia actually shot 50% from the field and scored 54 points in the paint, but the Sixers could not match New York’s perimeter production. The Knicks connected on 57% of their three-point attempts, compared with only 23% for Philadelphia. That difference shaped almost every important part of the game.
Knicks vs 76ers Match Player Stats: Game Overview
The fourth meeting between the Knicks and 76ers took place at Xfinity Mobile Arena in Philadelphia. New York entered the game with a 3-0 series advantage and needed one more victory to reach the Eastern Conference Finals.
The Knicks did not wait long to establish control.
New York scored 43 points in the first quarter while Philadelphia managed 24. The Knicks continued their offensive pressure in the second period, adding another 38 points. At halftime, New York had a 24-point advantage.
The third quarter was even more damaging for Philadelphia. New York scored 41 points and extended the lead substantially before easing off in the fourth quarter.
Here is the quarter-by-quarter scoring:
| Quarter | Knicks | 76ers |
| Q1 | 43 | 24 |
| Q2 | 38 | 33 |
| Q3 | 41 | 26 |
| Q4 | 22 | 31 |
| Final | 144 | 114 |
The 30-point final margin does not fully describe how one-sided the game became. New York led by as many as 44 points, and the official game record shows only one lead change. (NBA)
The fourth quarter was largely played after the main outcome had already been decided. Philadelphia outscored New York 31-22 in that period, but the comeback was never realistic because the Knicks had created such a large cushion during the opening three quarters.
Game Information
- Teams: New York Knicks vs Philadelphia 76ers
- Round: Eastern Conference Semifinals, Game 4
- Venue: Xfinity Mobile Arena, Philadelphia
- Attendance: 19,746
- Final score: Knicks 144, 76ers 114
- Series result: Knicks won 4-0
- Broadcast: ABC
- Officials: Sean Wright, John Goble, Nick Buchert and Andy Nagy
One date detail is worth clarifying. The official NBA game record lists the contest as Sunday, May 10, 2026, while the associated recap was published on May 11. Therefore, the game itself was played on May 10, with coverage published the following day. (NBA)
Knicks Offensive Performance
New York’s offense was the defining feature of the game.
The Knicks finished 49-for-91 from the field, giving them a 54% field-goal percentage. They were even more efficient from outside, making 25 of 44 three-point attempts for 57%.
That combination created a difficult defensive problem for Philadelphia.
The Sixers could not simply protect the three-point line because New York also produced 40 points in the paint. When Philadelphia attempted to defend the perimeter, the Knicks could attack inside. When Philadelphia collapsed toward the paint, New York had enough shooting to punish those rotations.
The team finished with:
- 49 made field goals on 91 attempts
- 25 made three-pointers on 44 attempts
- 21 made free throws on 29 attempts
- 47 total rebounds
- 33 assists
- 9 turnovers
- 6 steals
- 4 blocks
The 33 assists are particularly important when evaluating the performance. The Knicks were not simply making difficult individual shots. They were creating efficient offensive possessions through ball movement and multiple playmakers.
The Three-Point Difference
The biggest statistical gap between the teams was three-point shooting.
New York:
25-for-44, 57%
Philadelphia:
8-for-35, 23%
That represents a difference of 17 made three-pointers.
In a game where both teams shot reasonably well overall, that perimeter gap was enormous. Philadelphia actually made 43 of 86 field goals, producing a 50% field-goal percentage. The Sixers were not completely ineffective from the field.
Their problem was that their scoring profile could not keep pace with New York’s combination of interior scoring and long-range shooting.
The official NBA analysis noted that New York made 18 of 29 three-point attempts in the first half alone, an extraordinary 62% rate. The Knicks eventually finished the game with 25 made threes, tying the single-game playoff record. (NBA)
Miles McBride Leads the Knicks
Miles McBride was the game’s leading scorer with 25 points.
His shooting line was particularly impressive:
- 29 minutes
- 25 points
- 7-for-10 field goals
- 7-for-9 three-pointers
- 4-for-4 free throws
- 4 rebounds
- 1 steal
McBride’s seven made three-pointers were the biggest individual shooting contribution of the night.
His impact was not limited to his final scoring total. His early shooting helped New York establish separation before Philadelphia could settle into the game.
McBride’s first-quarter shooting was especially important. New York opened the game aggressively from beyond the arc, and McBride became a central part of that attack.
For a player who scored 25 points on only 10 field-goal attempts, efficiency is the most interesting part of his performance. He made seven of his nine attempts from three-point range and did not miss a free throw.
That means the box score shows much more than simply “25 points.” It shows that McBride converted a large percentage of his limited opportunities and stretched the Philadelphia defense throughout his minutes.
Jalen Brunson’s 22 Points
Jalen Brunson entered the game as one of New York’s primary offensive creators and finished with 22 points.
His complete line included:
- 28 minutes
- 22 points
- 8-for-17 shooting
- 6-for-10 from three-point range
- 4 rebounds
- 6 assists
Brunson’s six made three-pointers were another major reason New York’s offense became so difficult to contain.
What makes his performance interesting is that he did not need a massive scoring total because the Knicks had several other players producing efficiently.
Brunson’s six assists also demonstrate his role as more than a scorer. He could attack Philadelphia’s defense directly while also creating opportunities for teammates.
That balance is important in playoff basketball. A high-usage guard does not necessarily need to take 25 or 30 shots when the surrounding lineup is making shots at an exceptional rate.
Karl-Anthony Towns Creates From the Center Position
Karl-Anthony Towns produced one of the most unusual statistical lines of the game.
In only 20 minutes, Towns recorded:
- 17 points
- 5-for-7 field goals
- 2-for-3 three-pointers
- 5-for-6 free throws
- 4 rebounds
- 10 assists
- 2 turnovers
- 2 blocks
- +23 plus/minus
The 10 assists stand out immediately.
Towns was not simply functioning as a traditional interior scorer. His passing allowed New York to move the ball through a big man who could threaten both inside and outside.
His three-point shooting also forced Philadelphia’s defense to account for him away from the basket.
The result was a highly efficient offensive performance without heavy minutes.
Towns’ +23 plus/minus also reflected how effectively the Knicks performed during his time on the floor.
Josh Hart Provides Energy and Spacing
Josh Hart contributed 17 points and was New York’s leading rebounder with nine boards.
His numbers were:
- 29 minutes
- 17 points
- 6-for-10 field goals
- 4-for-6 three-pointers
- 1-for-1 free throws
- 9 rebounds
- 1 assist
- 1 steal
- 1 block
- +30 plus/minus
Hart’s four made three-pointers were especially valuable because his offensive contribution complemented the scoring of Brunson and McBride.
His nine rebounds also helped New York win the overall rebounding battle.
The +30 plus/minus is another indication of how strongly the Knicks performed during his minutes.
Mikal Bridges Adds Playmaking and Defense
Mikal Bridges scored 12 points while contributing across several categories.
His line included:
- 28 minutes
- 12 points
- 6-for-10 field goals
- 0-for-2 three-pointers
- 4 rebounds
- 6 assists
- 1 turnover
- 3 steals
- +31 plus/minus
Bridges did not need to make three-pointers to have an impact.
His six assists helped maintain New York’s offensive movement, while three steals added defensive value.
This is a good example of why player statistics should not be judged only by scoring. Bridges scored 12 points, but his defensive activity, passing and efficiency were all important parts of New York’s overall performance.
Philadelphia 76ers Player Performance
Philadelphia had several individual performances worth examining even though the team lost by 30 points.
Joel Embiid was the Sixers’ leading scorer with 24 points, while Tyrese Maxey finished with 17. Kelly Oubre Jr. scored 10 points.
The challenge for Philadelphia was that these contributions were not enough to overcome the difference in three-point shooting, rebounding and overall offensive volume.
The Sixers finished:
- 43-for-86 from the field
- 8-for-35 from three-point range
- 20-for-28 from the free-throw line
- 30 rebounds
- 24 assists
- 9 turnovers
- 5 steals
- 3 blocks
Philadelphia actually shot 50% from the field.
That statistic makes the final score more interesting. A team can shoot 50% and still lose by 30 when its opponent combines similar overall shooting efficiency with significantly better three-point production.
Joel Embiid’s 24 Points
Joel Embiid led Philadelphia with 24 points.
His shooting performance was highly efficient:
- 28 minutes
- 24 points
- 8-for-8 field goals
- 2-for-2 three-pointers
- 6-for-7 free throws
- 5 rebounds
- 4 assists
- 3 turnovers
- -24 plus/minus
Embiid did not struggle as an individual scorer.
In fact, he made every one of his eight field-goal attempts.
The larger issue was the difference between individual efficiency and team efficiency. Philadelphia could get productive possessions from Embiid, but New York’s offense was producing points from several players at the same time.
That made it difficult for Embiid’s scoring to influence the overall direction of the game.
Tyrese Maxey’s 17 Points
Tyrese Maxey played 33 minutes and finished with 17 points.
His line:
- 6-for-16 field goals
- 1-for-7 three-pointers
- 4-for-6 free throws
- 2 rebounds
- 4 assists
- 2 turnovers
- 17 points
Maxey’s biggest difficulty was three-point efficiency.
He attempted seven three-pointers and made only one.
Against a New York team that was making threes at a 57% rate, Philadelphia needed more perimeter production from its backcourt.
Maxey still contributed four assists and remained one of Philadelphia’s main offensive creators, but his shooting numbers illustrate the larger problem facing the Sixers.
VJ Edgecombe’s All-Around Contribution
VJ Edgecombe recorded eight points, six rebounds, seven assists and one block.
His shooting numbers were:
- 4-for-14 from the field
- 0-for-6 from three-point range
The seven assists were a positive part of his performance, particularly because Philadelphia needed additional playmaking.
However, his inability to convert from three-point range added to Philadelphia’s overall perimeter struggles.
The Sixers finished only 8-for-35 from beyond the arc, and Edgecombe was 0-for-6.
Paul George’s Difficult Shooting Night
Paul George finished with seven points in 27 minutes.
His statistical line:
- 3-for-7 field goals
- 1-for-4 three-pointers
- 1 rebound
- 2 assists
- 2 turnovers
- -35 plus/minus
The -35 was tied with Maxey for Philadelphia’s lowest listed plus/minus among the major players provided in the game data.
George’s seven points were not enough to provide the secondary scoring Philadelphia needed while New York was producing from multiple positions.
Knicks vs 76ers Match Player Stats and the Rebounding Battle
The Knicks won the rebounding battle 47-30.
That is a 17-rebound advantage.
Rebounding was not as dramatic as the three-point shooting difference, but it helped New York control possessions and limit Philadelphia’s opportunities.
Josh Hart led the Knicks with nine rebounds, while Towns added four and several other players contributed.
Philadelphia’s leading rebounders were Tyrese Martin with six and Joel Embiid with five.
The rebounding difference becomes more important when combined with shooting efficiency.
New York was not merely making outside shots. The Knicks were also securing missed shots and creating additional opportunities.
A 17-rebound advantage can influence both ends of the floor. Defensive rebounds end possessions, while offensive rebounds can create second chances.
Ball Movement Was Another Major Difference
New York finished with 33 assists compared with 24 for Philadelphia.
That nine-assist difference helps explain why the Knicks were able to generate efficient shots across the lineup.
Karl-Anthony Towns led New York with 10 assists, while Brunson and Bridges each recorded six.
This distribution is important.
New York did not depend entirely on one ball-dominant guard to create every scoring opportunity. Multiple players contributed to the team’s passing structure.
Philadelphia also moved the ball reasonably well, with Maxey recording four assists and Embiid four. However, the Sixers did not convert their possessions into enough efficient three-point scoring.
Turnovers Did Not Decide the Game
Both teams finished with nine turnovers.
That means turnovers cannot explain the 30-point margin.
This is useful when studying the box score because it removes one common explanation for a blowout.
New York did not win because Philadelphia repeatedly gave the ball away.
Instead, the biggest differences came from:
- Three-point shooting
- Rebounding
- Assist production
- Overall offensive efficiency
- New York’s explosive first three quarters
The Knicks also produced six steals and four blocks, compared with five steals and three blocks for Philadelphia.
Why the First Quarter Changed the Game
The opening 12 minutes were critical.
New York scored 43 points while Philadelphia managed 24.
That created a 19-point difference immediately.
The Knicks were already shooting confidently from outside, and Philadelphia had to spend the rest of the game trying to recover from a deficit created before halftime.
New York’s first-quarter shooting also influenced the psychology of the game. Once a team builds a large early lead through efficient shooting, the trailing team has to take greater offensive risks.
That can produce more three-point attempts, quicker possessions and less patience.
Philadelphia eventually scored 31 points in the fourth quarter, but the game had already moved beyond reach.
Comparing the Four Games in the Series
The series results were:
| Game | Result |
| Game 1 | Knicks 137, 76ers 98 |
| Game 2 | Knicks 108, 76ers 102 |
| Game 3 | Knicks 108, 76ers 94 |
| Game 4 | Knicks 144, 76ers 114 |
New York therefore won all four games.
The series margins were 39, 6, 14 and 30 points.
This demonstrates that the sweep was not based on four identical performances. Game 2 was relatively close, while Games 1 and 4 featured much larger margins.
The fourth game was the most explosive offensive performance of the series.
The official NBA series page confirms the 4-0 result and lists the four individual game scores. (NBA)
What the Series Statistics Reveal
Looking beyond Game 4 provides a broader understanding of the matchup.
New York’s success came from several repeatable strengths.
Multiple Scoring Options
The Knicks had several players capable of producing meaningful scoring totals.
In Game 4 alone:
- McBride scored 25
- Brunson scored 22
- Towns scored 17
- Hart scored 17
- Bridges scored 12
That distribution made it difficult for Philadelphia to concentrate defensive attention on one player.
Perimeter Shooting
The Knicks finished Game 4 with 25 made three-pointers.
That was not just a high-volume shooting night. It was also an extremely efficient one, with New York converting 57% of its attempts from beyond the arc.
Playmaking From Different Positions
Towns’ 10 assists were particularly significant.
When a center can create scoring opportunities for teammates while also shooting from outside, the defensive structure becomes more complicated.
Brunson and Bridges each added six assists.
Defensive Activity
Bridges recorded three steals.
Towns and Hart each added a block.
The Knicks did not need to force turnovers to win, but their defensive activity helped create additional opportunities.
The Biggest Statistical Mismatch
The clearest mismatch in the box score is three-point shooting.
New York made 25 threes.
Philadelphia made eight.
That is a difference of 17 made three-pointers.
Because each successful three is worth three points, the raw scoring value of that difference was substantial.
New York scored 75 points from three-point baskets.
Philadelphia scored 24.
That means the Knicks generated 51 more points from made three-pointers.
Philadelphia did score 54 points in the paint compared with New York’s 40, but that advantage could not compensate for the perimeter gap.
This is one of the most important lessons from the game: field-goal percentage alone does not tell the full story.
Philadelphia shot 50% overall.
New York shot 54%.
Those percentages are relatively close.
But once the location and value of those shots are considered, the difference becomes much larger.
Understanding Plus/Minus in This Game
Plus/minus is useful in this particular game because the Knicks’ dominant stretches were so large.
New York’s listed leaders included:
- Miles McBride: +33
- Mikal Bridges: +31
- Jalen Brunson: +31
- Josh Hart: +30
- Karl-Anthony Towns: +23
Philadelphia’s major players were all in negative territory among the provided statistics:
- Paul George: -35
- Tyrese Maxey: -35
- VJ Edgecombe: -33
- Kelly Oubre Jr.: -28
- Joel Embiid: -24
Plus/minus should not be treated as a standalone measure of individual quality because it is influenced by teammates, opponents and lineup combinations.
In a 30-point game, however, the numbers provide a useful snapshot of which lineups were on the floor during the largest scoring swings.
Why Karl-Anthony Towns’ 10 Assists Matter
The most unusual individual statistic from the game may be Towns’ 10 assists in only 20 minutes.
His scoring was efficient, but his passing created an additional problem for Philadelphia.
A traditional defensive approach against a center often focuses on limiting interior scoring.
Towns creates another layer because he can:
- Stretch the floor with three-point shooting.
- Attack closeouts.
- Pass to cutters.
- Find perimeter shooters.
- Create from the top or high post.
His 10 assists show that New York did not need him to score 25 or 30 points to dominate his minutes.
His value came through multiple parts of the offense.
Why Miles McBride’s Shooting Was So Important
McBride’s seven made threes were not simply an impressive personal statistic.
They changed the geometry of the court.
Every time McBride converted from outside, Philadelphia had to respect him farther from the basket.
That creates additional space for other Knicks players.
McBride finished 7-for-9 from three-point range, which is an exceptional shooting performance.
He also made all four of his free throws.
His 25 points came from only 10 field-goal attempts, demonstrating how much value he generated from efficient perimeter shooting.
What Philadelphia Could Not Overcome
Philadelphia’s biggest challenge was not one isolated statistical weakness.
Several smaller disadvantages combined.
The Sixers:
- Made only eight three-pointers.
- Shot 23% from three.
- Lost the rebounding battle by 17.
- Recorded nine fewer assists.
- Allowed New York to score 144 points.
- Fell behind by 19 points after the first quarter.
- Faced a Knicks lineup with five major scoring contributors.
Philadelphia did shoot 50% from the field and made 20 of 28 free throws.
That means the loss was not caused by complete offensive failure.
Instead, the game became a contest between two very different scoring profiles, and New York’s profile produced substantially more points.
A Closer Look at Efficiency
The Knicks’ 54% field-goal percentage was already strong.
But their 57% three-point percentage was the statistic that separated the teams.
New York also shot 72% from the free-throw line.
Philadelphia shot 71% from the line, so free throws were essentially even.
This helps isolate the key difference.
Free-throw efficiency did not decide the game.
Overall field-goal efficiency mattered, but it was not dramatically different.
The most significant separation came from three-point accuracy and volume.
The Importance of Shot Distribution
Basketball statistics become more meaningful when viewed together.
Suppose two teams both shoot around 50% from the field.
At first glance, their offensive efficiency might appear similar.
But if one team takes and makes many more three-pointers, the expected scoring value of its possessions can be significantly higher.
That is exactly what happened here.
The Knicks combined:
- 49 total field goals
- 25 three-pointers
- 33 assists
- 47 rebounds
Philadelphia recorded:
- 43 total field goals
- 8 three-pointers
- 24 assists
- 30 rebounds
The numbers reveal why the final score was so large.
How the Game Fits Into the Knicks’ Playoff Run
The victory sent New York to the Eastern Conference Finals for the second consecutive season.
The Knicks entered the Philadelphia series after eliminating Atlanta and then completed another sweep.
The official NBA recap described the Game 4 performance as an exceptionally efficient offensive showing through the first three quarters. (NBA)
The victory also gave New York seven consecutive playoff wins according to the NBA’s game coverage.
That context matters because the 144-point performance was not an isolated regular-season scoring explosion. It came during a postseason series in which every possession carried additional importance.
Frequently Asked Questions
Who led the Knicks in scoring against the 76ers?
Miles McBride led New York with 25 points. He shot 7-for-10 from the field and 7-for-9 from three-point range.
Who led the 76ers in scoring?
Joel Embiid led Philadelphia with 24 points. He went 8-for-8 from the field, 2-for-2 from three-point range and 6-for-7 at the free-throw line.
What was the final score between the Knicks and 76ers?
The Knicks defeated the 76ers 144-114 in Game 4 of the Eastern Conference Semifinals.
How many three-pointers did the Knicks make?
New York made 25 of 44 three-point attempts, shooting 57% from beyond the arc.
How many assists did Karl-Anthony Towns have?
Karl-Anthony Towns recorded 10 assists in 20 minutes. He also scored 17 points, grabbed four rebounds and blocked two shots.
Did the Knicks sweep the 76ers?
Yes. New York won all four games of the Eastern Conference Semifinals, completing a 4-0 series sweep.
Conclusion
The knicks vs 76ers match player stats from Game 4 show a complete team performance rather than a victory driven by one superstar.
Miles McBride’s 25 points and seven three-pointers provided the headline scoring performance. Jalen Brunson added 22 points and six assists, Josh Hart delivered 17 points and nine rebounds, Mikal Bridges contributed 12 points, six assists and three steals, while Karl-Anthony Towns produced an unusual 17-point, 10-assist performance in only 20 minutes.
Philadelphia had its own efficient individual performance from Joel Embiid, who scored 24 points without missing a field-goal attempt. Tyrese Maxey added 17 points and seven assists according to the supplied game data, while VJ Edgecombe contributed seven assists and six rebounds.
The major difference was the overall structure of the game. New York shot 54% from the field, 57% from three and collected 47 rebounds. Philadelphia shot 50% overall but only 23% from three and finished with 30 rebounds.
The result was a 144-114 Knicks victory and a 4-0 series sweep.
For readers studying player statistics, the most useful takeaway is that the box score becomes much more informative when individual scoring is considered alongside shooting location, assists, rebounding, defensive activity and lineup impact. This game provides a clear example of how a team can win decisively even when the opponent also shoots 50% from the field.