Celtics vs Detroit Pistons Match Player Stats
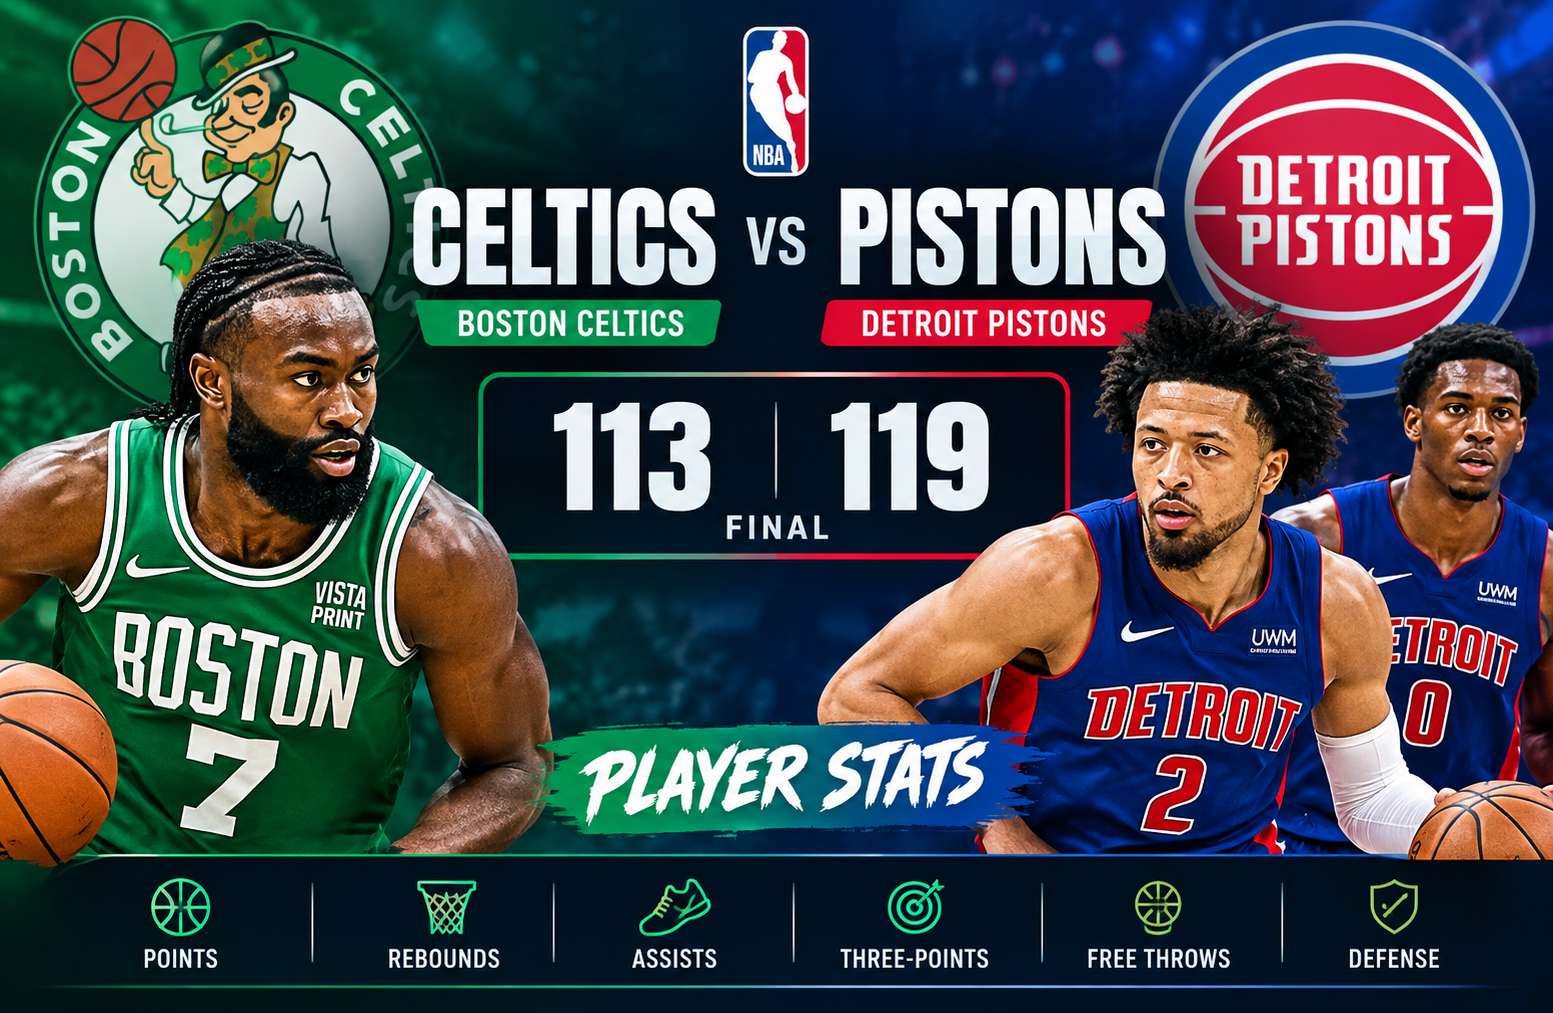
The celtics vs detroit pistons match player stats from October 27, 2025, tell a much more detailed story than the final score alone. Detroit defeated Boston 119-113 at Little Caesars Arena, but the game was shaped by several different factors: Jalen Duren’s dominant rebounding, Cade Cunningham’s playmaking, Ausar Thompson’s two-way impact, Jaylen Brown’s 41-point scoring performance, and Detroit’s ability to generate extra possessions. The Pistons finished with 55 rebounds, including 19 offensive boards, while Boston collected 38 total rebounds. That 17-rebound difference became one of the defining statistical gaps of the night.
The game also showed an interesting contrast in shooting profiles. Boston made 15 three-pointers compared with Detroit’s nine, yet the Pistons still won because they were significantly more efficient at the free-throw line and controlled the glass. Detroit shot 32-of-36 from the line for 89%, while Boston went 18-of-24 for 75%.
For readers looking beyond the scoreboard, this matchup provides a useful example of why individual box-score production needs to be examined alongside team-level efficiency, possession control, and lineup impact.
Celtics vs Detroit Pistons Match Player Stats: Game Overview
Detroit entered the matchup with a 1-1 record and improved to 2-1 after the victory. Boston fell to 0-3, including a 0-2 mark on the road according to the supplied game data.
The game was played on October 27, 2025, at Little Caesars Arena in Detroit, Michigan, with an announced attendance of 20,062.
Final Score
| Team | Q1 | Q2 | Q3 | Q4 | Total |
| Boston Celtics | 33 | 25 | 23 | 32 | 113 |
| Detroit Pistons | 24 | 36 | 34 | 25 | 119 |
Boston actually won the first quarter 33-24 and also outscored Detroit 32-25 in the fourth. The difference came primarily in the middle of the game.
Detroit scored 36 points in the second quarter and 34 in the third, producing a combined 70 points across those two periods. Boston scored only 48 during the same stretch.
That 22-point differential across the second and third quarters created enough separation for Detroit to withstand Boston’s fourth-quarter push.
Team Statistical Comparison
The overall team numbers reveal why Detroit was able to win despite Boston making six more three-pointers.
| Statistic | Boston Celtics | Detroit Pistons |
| Points | 113 | 119 |
| Field Goals | 40-94 | 39-93 |
| Field Goal Percentage | 43% | 42% |
| Three-Pointers | 15-45 | 9-34 |
| Three-Point Percentage | 33% | 26% |
| Free Throws | 18-24 | 32-36 |
| Free-Throw Percentage | 75% | 89% |
| Rebounds | 38 | 55 |
| Offensive Rebounds | 12 | 19 |
| Defensive Rebounds | 26 | 36 |
| Assists | 17 | 22 |
| Turnovers | 12 | 16 |
| Steals | 11 | 7 |
| Blocks | 8 | 5 |
| Personal Fouls | 26 | 24 |
One of the clearest observations is that the teams were remarkably close in overall field-goal production.
Boston made 40 of 94 attempts, while Detroit made 39 of 93. The difference was not primarily about the number of field goals.
Instead, Detroit created an advantage through free throws and rebounding.
The Pistons attempted 36 free throws and converted 32. Boston attempted 24 and made 18. That gave Detroit 14 more made free throws.
Detroit also secured 17 more rebounds overall.
Those two areas helped offset Boston’s advantage from three-point range.
Jaylen Brown Leads Boston With 41 Points
Jaylen Brown was the biggest individual scorer in the game.
He finished with:
- 41 points
- 12-of-25 field goals
- 5-of-9 three-pointers
- 12-of-15 free throws
- 6 rebounds
- 4 assists
- 4 turnovers
- 35 minutes
Brown’s 41 points represented more than one-third of Boston’s 113 total points.
His perimeter shooting was particularly important. Brown made five of his nine three-point attempts, giving Boston a major source of efficient scoring from outside.
He also generated 15 free-throw attempts, converting 12.
That combination of three-point shooting and free-throw production allowed Brown to remain highly productive even though Boston struggled to maintain its offensive rhythm during the second and third quarters.
His plus/minus was -1, meaning Boston was outscored by one point during his minutes on the floor.
That number is useful context. Brown produced an enormous individual scoring line, but Detroit’s overall control of the game prevented Boston’s star performance from translating into a victory.
Payton Pritchard Provides a Double-Digit Rebounding Performance
Payton Pritchard delivered one of Boston’s most complete statistical performances.
He recorded:
- 21 points
- 10 rebounds
- 4 assists
- 8-of-16 shooting
- 2-of-8 from three-point range
- 3-of-5 free throws
- 3 offensive rebounds
- 7 defensive rebounds
- 34 minutes
The 10 rebounds were especially notable for a Boston guard.
Pritchard’s three offensive rebounds also helped Boston generate additional possessions. However, Boston’s overall 38-rebound total remained far behind Detroit’s 55.
His plus/minus was -4.
Pritchard’s performance demonstrates why box-score analysis should not focus exclusively on scoring. His 21 points were valuable, but his rebounding contribution was arguably just as important given Detroit’s dominance on the glass.
Derrick White Supplies Defense and Playmaking
Derrick White finished with 15 points, four rebounds, three assists, four steals, and three blocks in 37 minutes.
His shooting line was 6-of-18 from the field and 3-of-11 from three.
The scoring efficiency was modest, but his defensive statistics stood out.
Four steals and three blocks gave White seven combined steals and blocks. That kind of defensive activity helped Boston finish with 11 steals and eight blocks as a team.
His plus/minus was +11, the second-highest mark among Boston players listed in the supplied statistics behind Neemias Queta’s +12.
White’s individual line is a good example of why judging a player purely through points can be misleading. His defensive activity and positive on-court differential were significant parts of Boston’s overall performance.
Neemias Queta Makes an Impact in Limited Minutes
Neemias Queta played 26 minutes and scored only four points, but his overall statistical contribution was substantial.
He recorded:
- 6 rebounds
- 3 assists
- 2 steals
- 3 blocks
- 3 offensive rebounds
- 3 defensive rebounds
- 5 fouls
- +12 plus/minus
His three blocks tied his Boston teammates for the team’s highest individual total in the supplied data.
Queta’s three offensive rebounds were also valuable because second-chance possessions were an important theme of the game.
His +12 was the strongest plus/minus among Boston players listed.
That statistic should not be treated as a complete individual evaluation, but it does provide useful context about the team’s point differential while he was on the floor.
Boston’s Bench Production
Boston received contributions from several reserve players.
Sam Hauser scored eight points in 24 minutes while shooting 3-of-7 from the field and 2-of-5 from three.
Josh Minott scored 10 points in 14 minutes. He shot 3-of-5 from the field, made his only three-point attempt, converted all three free throws, and added three steals.
Anfernee Simons contributed 12 points in 23 minutes on 5-of-13 shooting, including 2-of-7 from three.
Luka Garza added two points and two rebounds in 13 minutes.
Chris Boucher finished without a point in nine minutes but recorded one rebound, one assist, and one block.
Baylor Scheierman played five minutes and recorded two rebounds without attempting a shot.
The reserve production was mixed, but Minott’s 10 points and three steals stood out in limited playing time.
Jalen Duren Dominates the Glass
Jalen Duren produced one of the most important statistical performances of the game.
He finished with:
- 24 points
- 18 rebounds
- 6-of-12 field goals
- 12-of-13 free throws
- 8 offensive rebounds
- 10 defensive rebounds
- 1 assist
- 4 turnovers
- 2 blocks
- 28 minutes
The 18 rebounds were the highest individual total in the matchup.
More importantly, eight of those rebounds came on the offensive glass.
That number directly relates to Detroit’s 19 offensive rebounds as a team.
Duren’s offensive rebounding created extra opportunities for Detroit after missed shots. Those additional possessions can be especially important in a game where the two teams have nearly identical field-goal totals.
His free-throw shooting was another major factor.
Duren made 12 of 13 free throws, producing 12 points from the line alone.
The combination of 24 points and 18 rebounds made him one of the central statistical figures in the matchup.
Cade Cunningham Controls Detroit’s Offense
Cade Cunningham finished with 25 points and eight assists in 38 minutes.
His full line included:
- 25 points
- 8-of-18 field goals
- 2-of-5 three-pointers
- 7-of-7 free throws
- 3 rebounds
- 8 assists
- 6 turnovers
- 1 block
- 4 personal fouls
- 0 plus/minus
The eight assists were the highest total by either team in the supplied player statistics.
Cunningham also went 7-for-7 from the free-throw line.
His six turnovers were a downside of an otherwise productive offensive night. That figure should be considered when assessing the complete performance because Cunningham handled a significant portion of Detroit’s offensive creation.
His 25 points and eight assists accounted for a large share of Detroit’s scoring and playmaking output.
The zero plus/minus indicates that the Pistons scored exactly as many points as Boston during his minutes on the floor, according to the supplied statistics.
Ausar Thompson Provides a Two-Way Spark
Ausar Thompson had one of Detroit’s most balanced performances.
He recorded:
- 21 points
- 12 rebounds
- 3 assists
- 2 steals
- 7-of-16 field goals
- 7-of-8 free throws
- 5 offensive rebounds
- 7 defensive rebounds
- +15 plus/minus
The 12 rebounds ranked second among all players in the game behind Duren’s 18.
Five offensive rebounds were particularly valuable.
Thompson also posted the highest plus/minus among the Detroit players listed, at +15.
That combination of scoring, rebounding, defensive activity, and positive on-court differential made his statistical contribution broader than his 21 points suggest.
His three-point shooting was limited, as he went 0-for-2 from deep, but he compensated by converting seven of eight free throws and attacking other scoring opportunities.
Tobias Harris Delivers an Efficient Veteran Performance
Tobias Harris finished with 18 points, eight rebounds, and four assists.
He shot 7-of-14 from the field, 2-of-7 from three, and 2-of-2 from the free-throw line.
He also added two offensive rebounds and six defensive rebounds.
Harris played 35 minutes and finished with a +7 plus/minus.
His four assists were tied for the highest total among Detroit players outside Cunningham’s eight.
The statistical profile shows a balanced contribution rather than a scoring-heavy performance.
His 18 points were useful, but his eight rebounds and four assists helped Detroit maintain production across multiple areas.
Duncan Robinson’s Perimeter Role
Duncan Robinson played 30 minutes and scored eight points.
He made two of seven field-goal attempts and two of seven three-point attempts. He also converted both of his free throws.
Robinson added four rebounds, one assist, and one steal.
His three-point attempts represented the majority of his field-goal attempts, reflecting a perimeter-oriented role in the supplied box score.
Although his scoring total was modest, Detroit did not need a high-scoring performance from every starter because Cunningham, Duren, Thompson, and Harris all produced double-digit totals.
Detroit’s Bench Contributions
Detroit’s reserves added several useful contributions.
Isaiah Stewart scored nine points while shooting 3-of-6 from the field and 2-of-2 from three. He also grabbed six rebounds, recorded one steal, and one block.
Ronald Holland II added seven points, two steals, and one block.
Javonte Green scored seven points and collected three offensive rebounds.
Daniss Jenkins recorded one assist and one steal in 10 minutes.
Chaz Lanier played five minutes without scoring.
The bench production helped Detroit maintain depth around its primary offensive players.
Stewart’s perfect two-for-two three-point shooting was particularly useful because Detroit as a team shot only 26% from three.
Why Detroit Won Despite Making Fewer Three-Pointers
At first glance, the three-point numbers might suggest an advantage for Boston.
Boston made 15 of 45 three-point attempts.
Detroit made nine of 34.
That is a six-made-three difference and an 18-point advantage from made three-pointers alone.
Yet Detroit won by six.
The explanation becomes clearer when looking at the rest of the box score.
1. Detroit Controlled Rebounding
Detroit had 55 rebounds compared with Boston’s 38.
That is a 17-rebound advantage.
The offensive rebounding gap was seven, with Detroit collecting 19 offensive boards against Boston’s 12.
Jalen Duren alone had eight offensive rebounds.
Ausar Thompson had five.
Those second-chance opportunities helped Detroit compensate for its lower three-point output.
2. Detroit Won the Free-Throw Battle
Detroit made 32 free throws.
Boston made 18.
That is a 14-free-throw difference in made shots.
Detroit also shot 89% from the line, compared with Boston’s 75%.
Duren went 12-of-13.
Cunningham went 7-of-7.
Thompson went 7-of-8.
Harris went 2-of-2.
That group combined for 28 made free throws.
3. Detroit Generated More Assists
The Pistons finished with 22 assists compared with Boston’s 17.
That five-assist advantage indicates more successful assisted scoring sequences for Detroit.
Cunningham’s eight assists were the largest individual contribution in that category.
4. Boston Had Fewer Turnovers
Boston actually held the advantage in turnovers.
The Celtics committed 12.
Detroit committed 16.
That gave Boston a four-turnover advantage.
Boston also recorded more steals, 11 to seven.
This was one of the areas where Boston performed better statistically, but it was not enough to overcome Detroit’s rebounding and free-throw advantages.
The Second and Third Quarters Changed the Game
The most important stretch came between the first and fourth quarters.
Boston led 33-24 after the opening period.
Detroit then exploded for 36 points in the second quarter while limiting Boston to 25.
The Pistons continued their momentum in the third, scoring 34 points against Boston’s 23.
Across those two quarters:
Detroit: 70 points
Boston: 48 points
Detroit therefore built a 22-point advantage across the middle two periods.
Boston responded with a 32-point fourth quarter, but the comeback attempt began from too large a deficit.
This quarter-by-quarter pattern is essential when examining the matchup because the final six-point margin does not show how large Detroit’s midgame advantage became.
Boston’s Three-Point Advantage Was Not Enough
Boston’s 15 made three-pointers were a major positive.
Jaylen Brown made five.
Derrick White made three.
Payton Pritchard made two.
Sam Hauser made two.
Anfernee Simons made two.
That distribution shows that Boston had multiple perimeter scoring sources.
Detroit, by comparison, made only nine threes.
However, three-point volume did not decide the entire game.
Boston attempted 45 threes compared with Detroit’s 34.
Detroit generated its offense through a different combination of free throws, rebounding, interior scoring, and assisted play.
The lesson from this box score is simple: a team can lose the three-point battle and still win when it creates enough advantages elsewhere.
Rebounding Was the Biggest Statistical Separation
The 55-38 rebounding difference deserves particular attention.
Detroit’s 19 offensive rebounds were especially significant.
Offensive rebounds give a team another possession after a missed shot. They can also create defensive pressure because the opposing team must repeatedly secure the defensive glass.
Duren’s eight offensive rebounds and Thompson’s five combined for 13.
That means those two players alone accounted for more than two-thirds of Detroit’s 19 offensive rebounds.
Boston’s leaders on the offensive glass were Pritchard with three and Queta with three.
Both were valuable contributions, but Detroit’s overall frontcourt activity remained substantially higher.
What the Plus/Minus Numbers Tell Us
Plus/minus measures the team’s point differential while a player is on the floor. It is useful as context, but it should not be treated as a standalone measure of individual quality.
Boston’s strongest listed plus/minus figures were:
- Neemias Queta: +12
- Derrick White: +11
- Sam Hauser: +5
- Jaylen Brown: -1
- Payton Pritchard: -4
- Hugo Gonzalez: -7
- Chris Boucher: -6
- Josh Minott: -11
- Luka Garza: -12
- Anfernee Simons: -13
Detroit’s listed figures included:
- Ausar Thompson: +15
- Tobias Harris: +7
- Isaiah Stewart: +4
- Ronald Holland II: +3
- Jalen Duren: +2
- Daniss Jenkins: +1
- Cade Cunningham: 0
- Javonte Green: 0
- Duncan Robinson: -6
- Chaz Lanier: +4
These numbers should be read alongside minutes, role, opponent lineups, and individual statistics rather than in isolation.
For example, Brown scored 41 points but finished at -1. That does not mean his scoring was ineffective. It simply means Boston was outscored by one point during his time on the court.
Likewise, Queta’s +12 does not mean he individually caused a 12-point swing. Plus/minus captures the team’s scoring margin during his minutes.
A Closer Look at Shooting Efficiency
Boston and Detroit were remarkably similar in field-goal percentage.
Boston shot 43%.
Detroit shot 42%.
That makes the final result more interesting because Detroit did not win by dramatically outperforming Boston in basic field-goal efficiency.
The difference came from the distribution of scoring opportunities.
Boston attempted 94 field goals.
Detroit attempted 93.
The teams therefore had nearly identical field-goal volume.
But Detroit had a major advantage at the free-throw line and on the offensive glass.
This is a useful reminder that shooting percentage alone cannot explain a basketball game.
A more complete analysis should examine:
- Field-goal attempts
- Three-point attempts
- Free-throw attempts
- Offensive rebounds
- Turnovers
- Assists
- Shot distribution
When those factors are considered together, Detroit’s victory becomes easier to understand.
Boston’s Defensive Activity Was Strong
Boston recorded 11 steals and eight blocks.
Derrick White contributed four steals and three blocks.
Neemias Queta added two steals and three blocks.
Josh Minott recorded three steals.
That defensive activity was a clear positive for Boston.
The Celtics also committed 12 turnovers compared with Detroit’s 16.
Therefore, Boston created several defensive advantages.
The problem was that Detroit generated enough offensive rebounds and free throws to offset those advantages.
Detroit’s Free-Throw Efficiency Was Crucial
Detroit’s 32 made free throws accounted for nearly 27% of its 119 points.
Duren, Cunningham, and Thompson were particularly effective at the line.
Their combined free-throw totals were:
- Duren: 12-of-13
- Cunningham: 7-of-7
- Thompson: 7-of-8
Together, they made 26 free throws.
That is a remarkable contribution from just three players.
Boston’s Brown made 12-of-15, but Boston did not receive the same volume of free throws from the rest of its rotation.
The difference at the line was therefore not simply about accuracy. It was also about how many scoring opportunities Detroit created there.
Individual Leaders at a Glance
Points
- Jaylen Brown: 41
- Cade Cunningham: 25
- Jalen Duren: 24
- Payton Pritchard: 21
- Ausar Thompson: 21
- Tobias Harris: 18
- Derrick White: 15
- Anfernee Simons: 12
Rebounds
- Jalen Duren: 18
- Ausar Thompson: 12
- Payton Pritchard: 10
- Tobias Harris: 8
- Jaylen Brown: 6
- Neemias Queta: 6
- Isaiah Stewart: 6
Assists
- Cade Cunningham: 8
- Jaylen Brown: 4
- Payton Pritchard: 4
- Tobias Harris: 4
- Derrick White: 3
- Ausar Thompson: 3
Steals
- Derrick White: 4
- Josh Minott: 3
- Neemias Queta: 2
- Ausar Thompson: 2
- Ronald Holland II: 2
Blocks
- Neemias Queta: 3
- Derrick White: 3
- Jalen Duren: 2
- Ronald Holland II: 1
- Isaiah Stewart: 1
- Cade Cunningham: 1
What the Matchup Reveals About Each Team
The statistical profile of the game suggests that Boston had several strengths.
The Celtics showed:
- Strong three-point production
- High defensive activity
- Fewer turnovers
- A 41-point performance from Brown
- Useful rebounding from Pritchard
- Significant defensive contributions from White and Queta
Detroit’s advantages were different.
The Pistons showed:
- Major rebounding superiority
- Strong offensive rebounding
- Excellent free-throw accuracy
- More assists
- Four 18-plus-point scorers
- Strong contributions from Duren and Thompson
- A balanced scoring structure
The difference was therefore less about one team dominating every category and more about which categories had the greatest impact on the final score.
Season Series Context
The supplied season-series data lists four meetings between the teams:
| Game | Date | Result |
| Game 1 | October 27 | Detroit 119, Boston 113 |
| Game 2 | November 27 | Detroit 117, Boston 114 |
| Game 3 | December 16 | Boston 112, Detroit 105 |
| Game 4 | January 20 | Boston 104, Detroit 103 |
The first meeting was therefore the opening chapter of a season series that later became more competitive.
For readers researching the matchup as part of a broader season analysis, it is useful to separate one game’s player statistics from the results of the entire series.
A single box score tells us what happened in that particular contest. A four-game series provides a broader view of how the teams performed against each other across multiple dates.
How to Read These Player Stats Correctly
A box score contains a large amount of information, but not every number answers the same question.
If you want to identify the leading scorer, points are the obvious starting point.
If you want to understand possession control, rebounds and turnovers become more important.
If you want to examine offensive creation, assists and shooting attempts provide additional context.
If you want to understand defensive activity, steals and blocks can help, although they do not capture every successful defensive play.
For this particular game, the most informative combination is:
Points + rebounds + free throws + offensive rebounds + turnovers + plus/minus.
That group captures much of the contrast between Boston’s perimeter scoring and Detroit’s possession-based approach.
The Biggest Statistical Takeaways
Several conclusions stand out from the supplied numbers.
Brown’s 41 Points Were Not Enough
Brown delivered the game’s highest scoring total by a significant margin.
However, Detroit’s balanced attack produced four players with at least 18 points.
That distribution reduced the Pistons’ dependence on one scorer.
Duren’s Rebounding Changed Possession Volume
Duren’s 18 rebounds, including eight offensive boards, were arguably among the most influential numbers in the box score.
The offensive rebounds gave Detroit extra opportunities and contributed to its overall 55-rebound advantage.
Thompson’s 12 Rebounds Added Frontcourt Pressure
Thompson’s 12 rebounds, including five offensive boards, reinforced Detroit’s control of the glass.
His 21 points also meant that his rebounding did not come at the expense of scoring production.
Cunningham Created Offense
Cunningham’s eight assists were the highest individual assist total in the game.
His 25 points also made him a major scoring threat.
The six turnovers are an important counterpoint, but his overall offensive responsibility was clear.
Boston Won Several Statistical Categories
The Celtics had more three-pointers, more steals, more blocks, and fewer turnovers.
Those are meaningful positives.
Detroit’s victory demonstrates that winning a game does not require leading every statistical category.
Frequently Asked Questions
Who scored the most points in the Celtics vs Pistons game?
Jaylen Brown led all players with 41 points for Boston. Cade Cunningham scored 25 for Detroit, while Jalen Duren scored 24.
Who had the most rebounds?
Jalen Duren led the game with 18 rebounds. He also collected eight offensive rebounds, helping Detroit finish with 55 total rebounds.
What was the final score?
The Detroit Pistons defeated the Boston Celtics 119-113 on October 27, 2025, at Little Caesars Arena.
Which team shot better from three-point range?
Boston shot 33% from three, making 15 of 45 attempts. Detroit shot 26%, making nine of 34 attempts.
Why did Detroit win despite making fewer three-pointers?
Detroit compensated through rebounding and free throws. The Pistons had a 55-38 rebounding advantage and made 32 free throws compared with Boston’s 18.
Who led the game in assists?
Cade Cunningham led all players with eight assists. He also scored 25 points and went 7-of-7 from the free-throw line.
Conclusion
The celtics vs detroit pistons match player stats from October 27, 2025, show a matchup decided by more than the final 119-113 score.
Jaylen Brown’s 41 points were the headline performance for Boston, while Payton Pritchard added 21 points and 10 rebounds. Derrick White supplied four steals and three blocks, and Neemias Queta produced a strong defensive and rebounding contribution in 26 minutes.
Detroit answered with a balanced statistical attack. Cade Cunningham scored 25 points and recorded eight assists. Jalen Duren delivered 24 points and 18 rebounds, including eight offensive boards. Ausar Thompson added 21 points and 12 rebounds, while Tobias Harris contributed 18 points and eight rebounds.
The largest team-level difference was on the glass. Detroit collected 55 rebounds to Boston’s 38 and generated 19 offensive rebounds. The Pistons also made 32 of 36 free throws, compared with Boston’s 18 of 24.
Boston’s superior three-point production and stronger defensive counting stats were not enough to offset those possession and free-throw advantages.
The matchup therefore stands as a useful example of how a basketball game can be won through multiple complementary statistical advantages, even when the winning team trails significantly in three-point production.