Kansas City Chiefs vs Tennessee Titans Match Player Stats
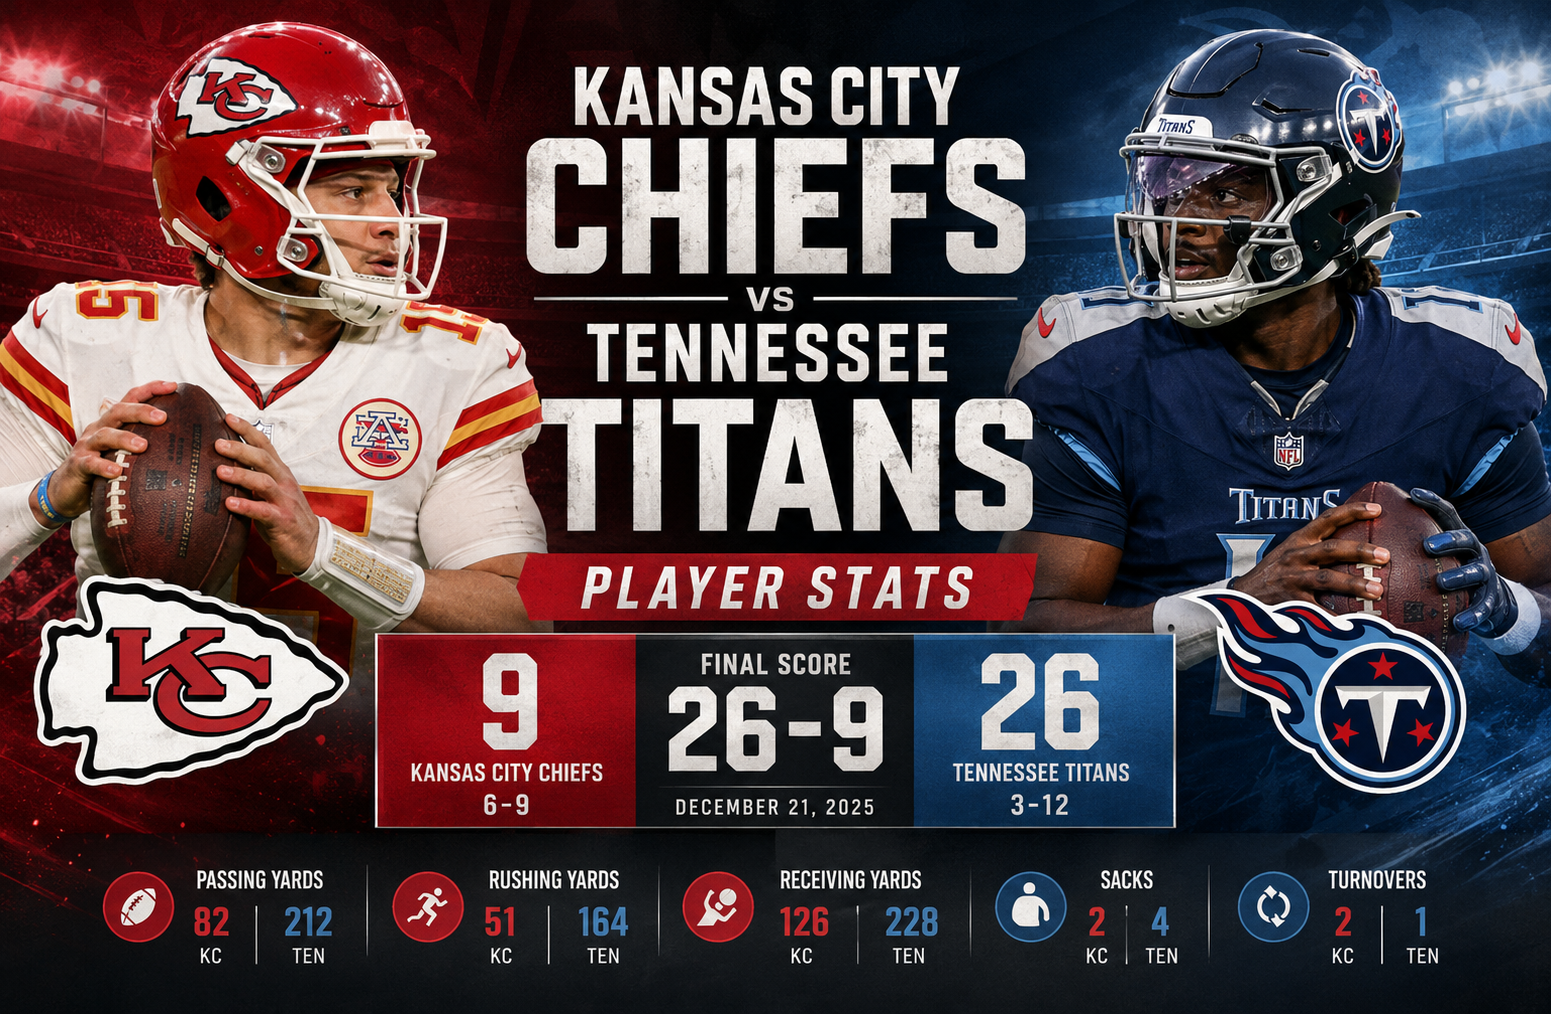
Kansas City Chiefs vs Tennessee Titans Match Player Stats from December 21, 2025, tell a clear story about how Tennessee controlled the game through balanced offense, efficient quarterback play, and a strong defensive performance. The Titans defeated the Chiefs 26-9, using 164 rushing yards and 228 passing yards by Cam Ward to keep Kansas City under pressure for most of the afternoon. For the Chiefs, the numbers were much harder to explain away. Kansas City produced only 82 net passing yards, 51 rushing yards, and no offensive touchdowns.
The final score alone does not fully explain this game. Tennessee’s advantage came from several connected areas rather than one spectacular statistical category. Tony Pollard provided the foundation on the ground, Tyjae Spears added an important touchdown and receiving production, while Ward completed 21 of 28 passes and finished with two touchdown passes without throwing an interception.
Kansas City, meanwhile, struggled to generate consistent offensive rhythm. Chris Oladokun completed 11 of 16 passes for 111 yards, but four sacks reduced the team’s passing output significantly. Gardner Minshew II added 15 passing yards on 3 of 8 attempts. The Chiefs also failed to produce a rushing touchdown or receiving touchdown.
The result was a 26-9 Tennessee victory that was reflected across the statistical sheet.
Kansas City Chiefs vs Tennessee Titans Match Player Stats: Game Overview
The Titans entered the matchup with a 2-12 record and improved to 3-12 with the victory. Kansas City fell to 6-9 overall and 1-6 on the road.
Here are the core numbers from the game:
| Category | Kansas City Chiefs | Tennessee Titans |
| Final Score | 9 | 26 |
| Passing | 14/24, 82 yards | 21/28, 212 yards |
| Rushing | 15 carries, 51 yards | 40 carries, 164 yards |
| Rushing Average | 3.4 | 4.1 |
| Passing TDs | 0 | 2 |
| Interceptions | 0 | 0 |
| Sacks Allowed | 4 | 2 |
| Total Fumbles | 2 | 1 |
| Field Goals | 3/4 | 1/1 |
| Extra Points | 0/0 | 3/3 |
One important statistical detail deserves clarification. Cam Ward is listed with 228 passing yards as an individual passer, while Tennessee’s team passing line is listed at 212 yards after two sacks for 16 yards. This is why quarterback passing yards and team net passing figures can differ on a box score.
That distinction matters when analyzing quarterback performance. A passer can throw for a certain number of yards while the offense’s net passing production is lower after sacks.
How Tennessee Controlled the Game
The biggest difference was Tennessee’s ability to maintain offensive balance.
The Titans attempted 40 rushing plays compared with only 28 passing attempts. That approach allowed Tennessee to stay committed to the ground game while still getting efficient production from Ward through the air.
Tony Pollard carried the ball 21 times for 102 yards, averaging 4.9 yards per carry. That workload was important because it consistently kept the Tennessee offense moving.
Tyjae Spears also contributed 52 rushing yards on 13 carries and scored one rushing touchdown. Together, Pollard and Spears accounted for 154 rushing yards.
That means the two primary Tennessee backs generated almost all of the team’s rushing production.
The Titans’ 164 rushing yards also represented more than three times Kansas City’s 51 rushing yards. That gap created a major difference in offensive sustainability.
Tennessee did not need to rely on explosive plays on every possession. Instead, the Titans repeatedly combined efficient runs with timely passing plays.
Cam Ward’s Efficient Passing Performance
Cam Ward delivered one of the most important individual performances of the game.
He completed 21 of 28 attempts, a completion rate of 75 percent, for 228 passing yards. He threw two touchdown passes and did not throw an interception.
His listed passer rating was 122.3, while his QBR was 34.6.
The completion percentage is particularly useful when looking at how efficiently Tennessee operated through the air. Ward did not need a huge volume of attempts to produce 228 passing yards.
His average was listed at 8.1 yards per attempt, showing that Tennessee was able to create meaningful gains while avoiding turnovers.
Ward was also sacked twice for 16 yards. Even with those sacks, Tennessee maintained a strong offensive profile because its rushing attack prevented the offense from becoming one-dimensional.
The most important takeaway is not simply that Ward threw two touchdowns. It is that he paired touchdown production with zero interceptions and a high completion rate.
That combination gave Tennessee a significant advantage over a Kansas City offense that produced no passing touchdowns.
Tony Pollard Led the Tennessee Ground Game
Tony Pollard was the leading rusher in the matchup.
He finished with:
- 21 carries
- 102 rushing yards
- 4.9 yards per carry
- 15-yard longest run
- 0 rushing touchdowns
Pollard’s workload stands out immediately.
He received 21 of Tennessee’s 40 rushing attempts, meaning he handled more than half of the team’s rushing workload. His 102 yards also accounted for more than 60 percent of Tennessee’s 164 rushing yards.
That production gave Tennessee a reliable early-down option and helped keep the offense from becoming overly dependent on passing.
Pollard also recorded one fumble, but it was not lost. That distinction is important. A fumble does not automatically mean a turnover occurred.
Tyjae Spears Added a Critical Touchdown
Tyjae Spears was another central piece of Tennessee’s victory.
He rushed 13 times for 52 yards, averaging 4.0 yards per carry. More importantly, he scored Tennessee’s rushing touchdown.
Spears also contributed significantly as a receiver, catching five passes for 53 yards.
That created a useful dual-threat contribution:
- 13 rushing attempts
- 52 rushing yards
- 5 receptions
- 53 receiving yards
- 1 rushing touchdown
His combined rushing and receiving yardage reached 105 yards.
This is one of the strongest examples of why player statistics should be evaluated beyond a single category. A player can influence a game without leading either rushing or receiving individually.
Spears did exactly that.
Tennessee’s Receiving Production Was Well Distributed
Tennessee’s receiving statistics show another major difference between the teams.
The Titans recorded 21 receptions for 228 yards and two touchdowns.
Chig Okonkwo led the team in receptions with six catches for 44 yards and a touchdown. He received eight targets, making him one of Ward’s most frequently targeted options.
Elic Ayomanor provided the team’s biggest average per catch among the primary receivers. He caught three passes for 58 yards, averaging 19.3 yards per reception.
Tyjae Spears caught five passes for 53 yards.
Chimere Dike added three receptions for 40 yards and one touchdown.
Van Jefferson finished with two catches for 24 yards, while Gunnar Helm had two catches for nine yards.
The distribution was significant because Tennessee did not need one receiver to dominate the box score.
Instead, several players contributed to the passing game.
Tennessee Receiving Leaders
| Player | Receptions | Yards | Average | TD | Long | Targets |
| Elic Ayomanor | 3 | 58 | 19.3 | 0 | 25 | 4 |
| Tyjae Spears | 5 | 53 | 10.6 | 0 | 34 | 5 |
| Chig Okonkwo | 6 | 44 | 7.3 | 1 | 15 | 8 |
| Chimere Dike | 3 | 40 | 13.3 | 1 | 30 | 5 |
| Van Jefferson | 2 | 24 | 12.0 | 0 | 15 | 2 |
| Gunnar Helm | 2 | 9 | 4.5 | 0 | 0 | 3 |
The numbers also show that Tennessee generated explosive gains without relying entirely on deep passing.
Spears had a 34-yard reception, Dike had a 30-yard reception, and Ayomanor recorded a 25-yard reception.
Kansas City’s Passing Game Struggled
Kansas City’s passing statistics were the clearest sign of its offensive problems.
Chris Oladokun completed 11 of 16 passes for 111 yards. He did not throw a touchdown or interception and finished with a listed 88.3 passer rating.
Gardner Minshew II completed 3 of 8 passes for 15 yards. He also had no touchdown and no interception and finished with a 45.8 passer rating.
Combined, the Chiefs completed 14 of 24 passes for 82 team passing yards after sacks.
The four sacks for 44 yards were especially costly.
Kansas City completed passes at a respectable rate overall, but completion percentage alone does not tell the story. The offense struggled to turn those completions into sustained yardage and touchdowns.
That is the key distinction.
A passing attack can complete a reasonable percentage of its attempts and still struggle if it cannot generate enough yards per attempt, explosive plays, or scoring opportunities.
Kansas City’s final passing line demonstrates that problem.
Chris Oladokun’s Numbers Need Context
Oladokun’s individual line was stronger than the final team passing total might suggest.
He completed 11 of 16 attempts, which equals 68.8 percent completions. He threw for 111 yards without an interception.
However, he was also responsible for four sacks in the Kansas City passing statistics.
Those sacks cost the Chiefs 44 yards.
This is why the team passing total was only 82 yards despite Oladokun’s individual passing yardage being higher.
The numbers point to an offense that had difficulty protecting the quarterback and sustaining possessions.
Oladokun did not turn the ball over through an interception, but avoiding interceptions was not enough to overcome the lack of offensive production.
Kansas City’s Rushing Attack Could Not Match Tennessee
Kansas City rushed 15 times for only 51 yards.
The team’s 3.4 yards per carry was lower than Tennessee’s 4.1 average, and the Chiefs did not score a rushing touchdown.
Isiah Pacheco led Kansas City’s rushing attack with eight carries for 34 yards. He averaged 4.3 yards per carry and had a longest run of six yards.
Gardner Minshew II added eight yards on one carry.
Chris Oladokun recorded seven yards on two carries.
Kareem Hunt had three carries for two yards.
Xavier Worthy received one rushing attempt but gained no yards.
The distribution shows that Kansas City never established a consistently productive ground game.
That made the passing struggles even more damaging.
When a team cannot run effectively, the quarterback and passing game generally face greater pressure to create first downs and explosive plays.
Kansas City did not get enough of either.
Isiah Pacheco Provided Value as a Receiver
Pacheco’s overall contribution was better than his rushing numbers alone indicate.
He rushed eight times for 34 yards but also caught six passes for 41 yards.
That gave him 75 yards from scrimmage.
His six receptions were the most among Kansas City players, and his seven targets were also the highest on the team.
His longest reception was 31 yards, which was the longest reception for either team in the provided Kansas City statistics.
This illustrates an important point when evaluating running backs.
Rushing yardage does not always capture a player’s complete offensive role. Pacheco was involved heavily in the passing game and provided one of Kansas City’s few sources of consistent receiving production.
Xavier Worthy Produced Kansas City’s Biggest Receiving Average
Xavier Worthy caught two passes for 41 yards.
His 20.5 yards per reception was the highest average among Kansas City’s listed receivers.
He also recorded a 28-yard reception.
However, Worthy received only three targets and did not score a touchdown.
That limited volume meant his explosive receiving efficiency did not translate into a major statistical workload.
His performance is a useful reminder that big-play ability and overall production are different measurements.
A receiver can produce an excellent yards-per-catch number while still having a relatively small role in the overall passing offense.
Kansas City Receiving Leaders
Kansas City’s 14 receptions produced 126 receiving yards with no touchdowns.
The leading contributors were:
| Player | Receptions | Yards | Average | TD | Long | Targets |
| Xavier Worthy | 2 | 41 | 20.5 | 0 | 28 | 3 |
| Isiah Pacheco | 6 | 41 | 6.8 | 0 | 31 | 7 |
| Hollywood Brown | 3 | 22 | 7.3 | 0 | 18 | 3 |
| JuJu Smith-Schuster | 1 | 12 | 12.0 | 0 | 12 | 4 |
| Travis Kelce | 1 | 6 | 6.0 | 0 | 6 | 4 |
| Brashard Smith | 1 | 4 | 4.0 | 0 | 4 | 1 |
The most striking number is the zero in the touchdown column.
Kansas City had several recognizable offensive contributors, but none of its listed receivers scored.
Travis Kelce, who received four targets, finished with one reception for six yards.
That was far below what Kansas City needed from its passing game in a nine-point performance.
Kansas City Defensive Leaders
Although the Chiefs struggled offensively, their defense generated several individual performances worth noting.
Kristian Fulton led Kansas City with 10 total tackles, including seven solo tackles.
Nick Bolton also recorded 10 total tackles, with four solo tackles, one sack, one tackle for loss, and one quarterback hit.
Drue Tranquill recorded 10 total tackles.
Bryan Cook added nine total tackles.
Jaylen Watson recorded seven tackles, while Chamarri Conner finished with six tackles and one sack.
Kansas City’s defense finished with:
- 93 total tackles
- 41 solo tackles
- 2 sacks
- 3 tackles for loss
- 5 quarterback hits
- 0 interceptions
- 0 defensive touchdowns
The tackle volume indicates that Kansas City’s defenders were heavily involved, but the overall defensive output did not produce enough game-changing plays to compensate for the offense.
Nick Bolton Was Active Throughout the Game
Nick Bolton’s line was one of Kansas City’s strongest defensive performances.
He recorded 10 total tackles, four solo tackles, one sack, one tackle for loss, and one quarterback hit.
His statistics show activity at multiple levels of the defense.
A linebacker recording tackles is expected, but the sack and quarterback hit add evidence of pressure beyond standard run defense.
Chamarri Conner also produced a sack and tackle for loss while recording six total tackles.
Together, those individual efforts helped Kansas City generate two sacks.
However, Tennessee’s offensive balance limited the impact of that pressure.
Tennessee’s Defense Generated More Pressure
Tennessee’s defensive statistics were particularly important because the Titans finished with four sacks compared with Kansas City’s two.
The Tennessee defense recorded:
- 46 total tackles
- 30 solo tackles
- 4 sacks
- 7 tackles for loss
- 5 passes defended
- 5 quarterback hits
- 0 interceptions
- 0 defensive touchdowns
James Williams Sr. led Tennessee with nine total tackles, eight of them solo, along with one sack and one tackle for loss.
Kemon Hall recorded five tackles and two tackles for loss.
Truman Jones produced 1.5 sacks, one tackle for loss, and two quarterback hits.
Jeffery Simmons recorded three tackles, two tackles for loss, and two passes defended.
The four-sack total was particularly damaging because Kansas City’s offense was already struggling to produce yardage.
James Williams Sr. Set the Defensive Tone
James Williams Sr. recorded nine total tackles and eight solo tackles.
That solo tackle total was the highest among Tennessee defenders listed in the game statistics.
He also added one sack and one tackle for loss.
His performance combined volume with direct impact behind the line of scrimmage.
Truman Jones was another standout pressure player with 1.5 sacks and two quarterback hits.
The Titans did not record an interception, but their ability to create pressure helped compensate for the lack of takeaways.
Special Teams Also Played a Role
Special teams did not decide the game by itself, but the statistics show competent contributions from both teams.
Kansas City’s Harrison Butker made three of four field-goal attempts and scored nine points.
His longest successful field goal was 54 yards.
Tennessee’s Joey Slye made his only field-goal attempt and converted all three extra-point attempts for six points.
The difference is notable.
Butker accounted for all nine Kansas City points, meaning the Chiefs did not score a touchdown.
Tennessee, by contrast, scored two touchdowns through the passing game and one rushing touchdown while also making a field goal and three extra points.
That touchdown production created the largest scoring gap.
Return Game Comparison
Nikko Remigio handled Kansas City’s kick and punt return responsibilities.
He returned four kicks for 95 yards, averaging 23.8 yards per return, with a long of 26 yards.
He also returned two punts for 31 yards, averaging 15.5 yards per return, including a 31-yard long.
Chimere Dike was active for Tennessee.
He returned five kicks for 122 yards, averaging 24.4 yards per return, with a 31-yard long.
Dike also recorded three punt returns for 23 yards.
His special teams contribution added another dimension to an already productive offensive game.
Punting Statistics
Matt Araiza punted five times for Kansas City.
He produced 219 total punt yards, averaging 43.8 yards per punt. His longest punt was 54 yards, and one punt landed inside the 20-yard line.
Johnny Hekker punted three times for Tennessee for 143 yards.
He averaged 47.7 yards per punt, had a long of 53 yards, and placed two punts inside the 20.
The punting numbers show that Tennessee had the stronger average, while both teams recorded multiple useful field-position punts.
Fumbles and Turnovers
Neither team recorded an interception.
Kansas City had two fumbles, but neither was lost.
Chris Oladokun recorded one fumble, while Nikko Remigio also recorded one. Trey Smith and Kevin Knowles each recorded a fumble recovery.
Tennessee had one fumble by Tony Pollard, but it was recovered by Tennessee.
As a result, neither team lost a fumble.
This is an interesting aspect of the game because the turnover column did not explain the final score.
Tennessee won without forcing an interception or recovering a Kansas City fumble.
Instead, the Titans built their advantage through offensive efficiency, rushing volume, touchdown production, and defensive pressure.
What the Numbers Say About the Final Score
The 26-9 result becomes easier to understand when the major statistical differences are placed together.
Tennessee produced:
- 164 rushing yards
- 212 team passing yards
- 2 passing touchdowns
- 1 rushing touchdown
- 21 receptions
- 4 sacks by the defense
- 7 tackles for loss
Kansas City produced:
- 51 rushing yards
- 82 team passing yards
- 0 passing touchdowns
- 0 rushing touchdowns
- 14 receptions
- 2 defensive sacks
- 3 tackles for loss
The difference is substantial.
Tennessee generated far more offensive yardage while also producing more defensive disruption.
The Titans did not need turnovers to win because their down-to-down performance created enough separation.
Three Numbers That Best Explain the Game
If someone wants to understand the matchup quickly, three statistical comparisons stand above the rest.
1. Rushing Yards: 164 to 51
Tennessee gained 113 more rushing yards than Kansas City.
That is a major advantage in both volume and control.
2. Team Passing Production: 212 to 82
Tennessee’s listed team passing figure was 212 yards, while Kansas City finished with 82 after sacks.
The difference was 130 yards.
That gap explains why Kansas City struggled to sustain scoring drives.
3. Sacks: Tennessee 4, Kansas City 2
Tennessee doubled Kansas City’s sack total.
The Titans also recorded seven tackles for loss compared with Kansas City’s three.
That combination indicates that Tennessee’s defense was more disruptive around the line of scrimmage.
Why Kansas City Scored Only Nine Points
Kansas City’s nine points came entirely from Harrison Butker’s field goals.
That means the Chiefs never reached the end zone.
The offense managed only 51 rushing yards and 82 net passing yards, while four sacks cost 44 passing yards.
Kansas City also had only 22 total targets among its listed receivers and produced zero receiving touchdowns.
The Chiefs did have some explosive receiving plays, particularly from Worthy and Pacheco, but those gains were not frequent enough to create consistent scoring opportunities.
The result was a low offensive ceiling.
Field goals can keep a team competitive, but when the opponent is scoring touchdowns, three-point possessions become difficult to sustain as a winning formula.
Why Tennessee’s Offensive Balance Worked
Tennessee’s offensive balance was arguably the most important tactical feature visible in the statistics.
The Titans ran the ball 40 times and passed 28 times.
That gave them multiple ways to attack Kansas City’s defense.
Pollard provided volume.
Spears provided both rushing and receiving production.
Ward delivered efficient passing and two touchdown throws.
The receivers also created several explosive plays.
This type of balance can make defensive planning more difficult because the offense is not dependent on a single source of production.
If the passing game slows down, Tennessee can lean on the running game.
If the defense focuses heavily on the run, Ward has multiple receiving options available.
Player Impact Beyond the Box Score
The box score cannot capture every tactical decision, but it can reveal which players carried the largest statistical responsibilities.
For Tennessee, Pollard’s 21 carries established the running game’s foundation. Spears’ combined 105 rushing and receiving yards made him one of the most versatile offensive contributors. Ward’s 75 percent completion rate and two touchdown passes gave Tennessee efficient quarterback production.
For Kansas City, Pacheco was involved in both phases of the offense and finished with 75 yards from scrimmage. Worthy provided explosive receiving efficiency, while Bolton, Fulton, and Tranquill were heavily involved defensively.
The problem for Kansas City was not necessarily a complete absence of individual effort.
The bigger issue was that those individual contributions did not combine into enough team-level production.
Kansas City Chiefs vs Tennessee Titans Match Player Stats: Key Takeaways
The Kansas City Chiefs vs Tennessee Titans Match Player Stats reveal several important lessons about the matchup.
First, Tennessee dominated the rushing volume and production.
Second, Cam Ward provided efficient quarterback play without turning the ball over.
Third, Tennessee’s receiving production was distributed across several players rather than concentrated in one target.
Fourth, Kansas City’s offense failed to score a touchdown.
Fifth, the Titans generated twice as many sacks and more tackles for loss.
Sixth, Kansas City’s best offensive efficiency came from individual plays rather than sustained production.
Seventh, neither team needed a takeaway to determine the outcome because Tennessee created a large enough statistical advantage through normal offensive and defensive execution.
A Closer Look at Offensive Efficiency
Efficiency is more useful than raw volume when evaluating a game like this.
Tennessee completed 21 of 28 passes, or 75 percent of its attempts.
Kansas City completed 14 of 24, or approximately 58.3 percent.
Tennessee also averaged 4.1 yards per rushing attempt compared with Kansas City’s 3.4.
That means Tennessee was more productive both through the air and on the ground.
The Titans also converted their offensive production into touchdowns.
Kansas City did not.
This is the central statistical difference between the teams.
What the Receiving Target Numbers Tell Us
Target distribution provides another useful layer of analysis.
Chig Okonkwo led Tennessee with eight targets and caught six passes.
Tyjae Spears received five targets and caught all five.
Chimere Dike received five targets and caught three.
Elic Ayomanor had four targets and three receptions.
Kansas City had a different distribution.
Pacheco led with seven targets and six receptions.
JuJu Smith-Schuster and Travis Kelce each received four targets, while Worthy and Hollywood Brown received three each.
The Chiefs had multiple players involved, but the overall passing production remained low.
The key difference was not simply how many players were targeted. Tennessee turned those opportunities into significantly more yardage and touchdowns.
What Fantasy Football Analysis Can Learn From the Game
Although this matchup was played in the NFL context rather than fantasy football, the player statistics offer several useful fantasy-related observations.
Pollard’s 102 rushing yards provided a strong rushing foundation, while Spears’ combined production demonstrated the value of players who contribute in both rushing and receiving.
Ward’s two passing touchdowns made him one of the most important fantasy-relevant players in the matchup.
For Kansas City, Pacheco’s six receptions were notable because receiving work can provide a stable source of points even when rushing efficiency is limited.
Worthy’s 41 receiving yards on only two catches also showed his big-play potential.
However, the absence of Kansas City touchdowns significantly limited the fantasy ceiling of its offensive players.
What Fantasy Managers Should Not Overreact To
One game should not automatically redefine a player’s long-term value.
A box score is a snapshot of a specific matchup, game plan, workload, and game environment.
For example, Worthy’s 20.5 yards per reception is impressive, but only two receptions came from three targets.
Likewise, Kelce’s one reception for six yards represents his production in this particular game, not a complete evaluation of his career or season.
The same principle applies to Ward.
His 122.3 passer rating was excellent in this matchup, but individual game statistics should always be separated from longer-term performance trends.
How to Read These Statistics Correctly
When analyzing a box score, avoid focusing on one number.
A better approach is to move through the game in layers:
- Start with the final score.
- Compare total offensive production.
- Compare rushing efficiency.
- Review passing efficiency.
- Check sacks and tackles for loss.
- Examine touchdowns.
- Review turnovers.
- Look at individual workloads.
- Separate volume from efficiency.
- Consider how the statistics connect.
This approach prevents misleading conclusions.
For example, Kansas City had a respectable 58.3 percent completion rate based on the combined 14-for-24 passing line, but that number becomes less impressive when paired with 82 team passing yards and four sacks.
Similarly, Tennessee’s two interceptions-free touchdown passes become more meaningful when viewed alongside 164 rushing yards and 4.1 yards per carry.
Why the Game Was Not Decided by Turnovers
A common assumption is that a large scoring margin must come from turnovers.
That was not the case here.
Neither team recorded an interception.
Kansas City had two fumbles, but none were lost.
Tennessee had one fumble, but it was recovered by the Titans.
Therefore, neither side received a traditional turnover advantage.
Tennessee’s victory was based more heavily on sustained execution.
That makes the game statistically interesting because the Titans created a 17-point margin without relying on defensive takeaways.
The Role of Field Position
Special teams also contributed to the broader statistical picture.
Dike averaged 24.4 yards per kick return for Tennessee, while Remigio averaged 23.8 for Kansas City.
On punts, Remigio averaged 15.5 yards per return compared with Dike’s 7.7.
Tennessee’s Hekker averaged 47.7 yards per punt and placed two inside the 20.
Kansas City’s Araiza averaged 43.8 yards and placed one inside the 20.
These numbers do not prove exactly how every possession began, but they show that both teams had meaningful special teams contributions.
The overall result, however, was still driven primarily by Tennessee’s offensive production and defensive pressure.
A Practical Framework for Comparing Future Match Player Stats
If you are researching another NFL matchup, use the same framework.
Start With Team Totals
Look at passing, rushing, sacks, touchdowns, and turnovers before focusing on individual players.
Identify Workload Leaders
Find the players who handled the most carries, targets, receptions, tackles, and defensive snaps when available.
Separate Volume From Efficiency
A player with 20 carries for 80 yards has a different statistical profile from one with 10 carries for 80 yards.
Both produced 80 yards, but the efficiency is different.
Look for Two-Way Contributions
Running backs and return specialists can influence games in several statistical categories.
Connect the Numbers to the Score
The best analysis explains why the statistics resulted in the final score.
That is more useful than simply repeating a box score.
Kansas City Chiefs vs Tennessee Titans Match Player Stats FAQ
Who won the Chiefs vs Titans game on December 21, 2025?
The Tennessee Titans defeated the Kansas City Chiefs 26-9.
How did Cam Ward perform against the Chiefs?
Cam Ward completed 21 of 28 passes for 228 yards with two touchdown passes and no interceptions. His listed passer rating was 122.3.
Who was Tennessee’s leading rusher?
Tony Pollard led Tennessee with 21 carries for 102 yards, averaging 4.9 yards per carry.
Who led Kansas City in rushing?
Isiah Pacheco led the Chiefs with eight carries for 34 yards.
Who led Kansas City in receiving?
Isiah Pacheco led the Chiefs with six receptions for 41 yards. Xavier Worthy also recorded 41 receiving yards on two catches.
Did either team throw an interception?
No. Neither Kansas City nor Tennessee recorded an interception in the game.
Conclusion
The Kansas City Chiefs vs Tennessee Titans Match Player Stats from December 21, 2025 show a game in which Tennessee won through consistent execution rather than a single statistical fluke.
The Titans rushed for 164 yards compared with Kansas City’s 51. Cam Ward completed 75 percent of his passes and threw two touchdowns without an interception. Tony Pollard surpassed 100 rushing yards, while Tyjae Spears contributed 105 combined rushing and receiving yards and scored a touchdown.
Kansas City’s offensive production was considerably more limited. The Chiefs finished with 82 team passing yards after sacks, 51 rushing yards, and no offensive touchdowns. Harrison Butker made three field goals, but the offense never reached the end zone.
Defensively, Tennessee also created more pressure, recording four sacks and seven tackles for loss. Kansas City recorded two sacks and three tackles for loss.
Perhaps the most important takeaway is that Tennessee did not need turnovers to create its advantage. Neither team intercepted a pass, and neither team lost a fumble. The Titans simply produced more yardage, more touchdowns, more rushing volume, and more defensive disruption.
For anyone studying this matchup, the box score provides a strong example of why individual statistics should be viewed as connected pieces of a larger game story. Pollard’s workload, Spears’ versatility, Ward’s efficiency, Tennessee’s receiving distribution, and the Titans’ defensive pressure all contributed to the same outcome.