Las Vegas Aces vs Seattle Storm Match Player Stats
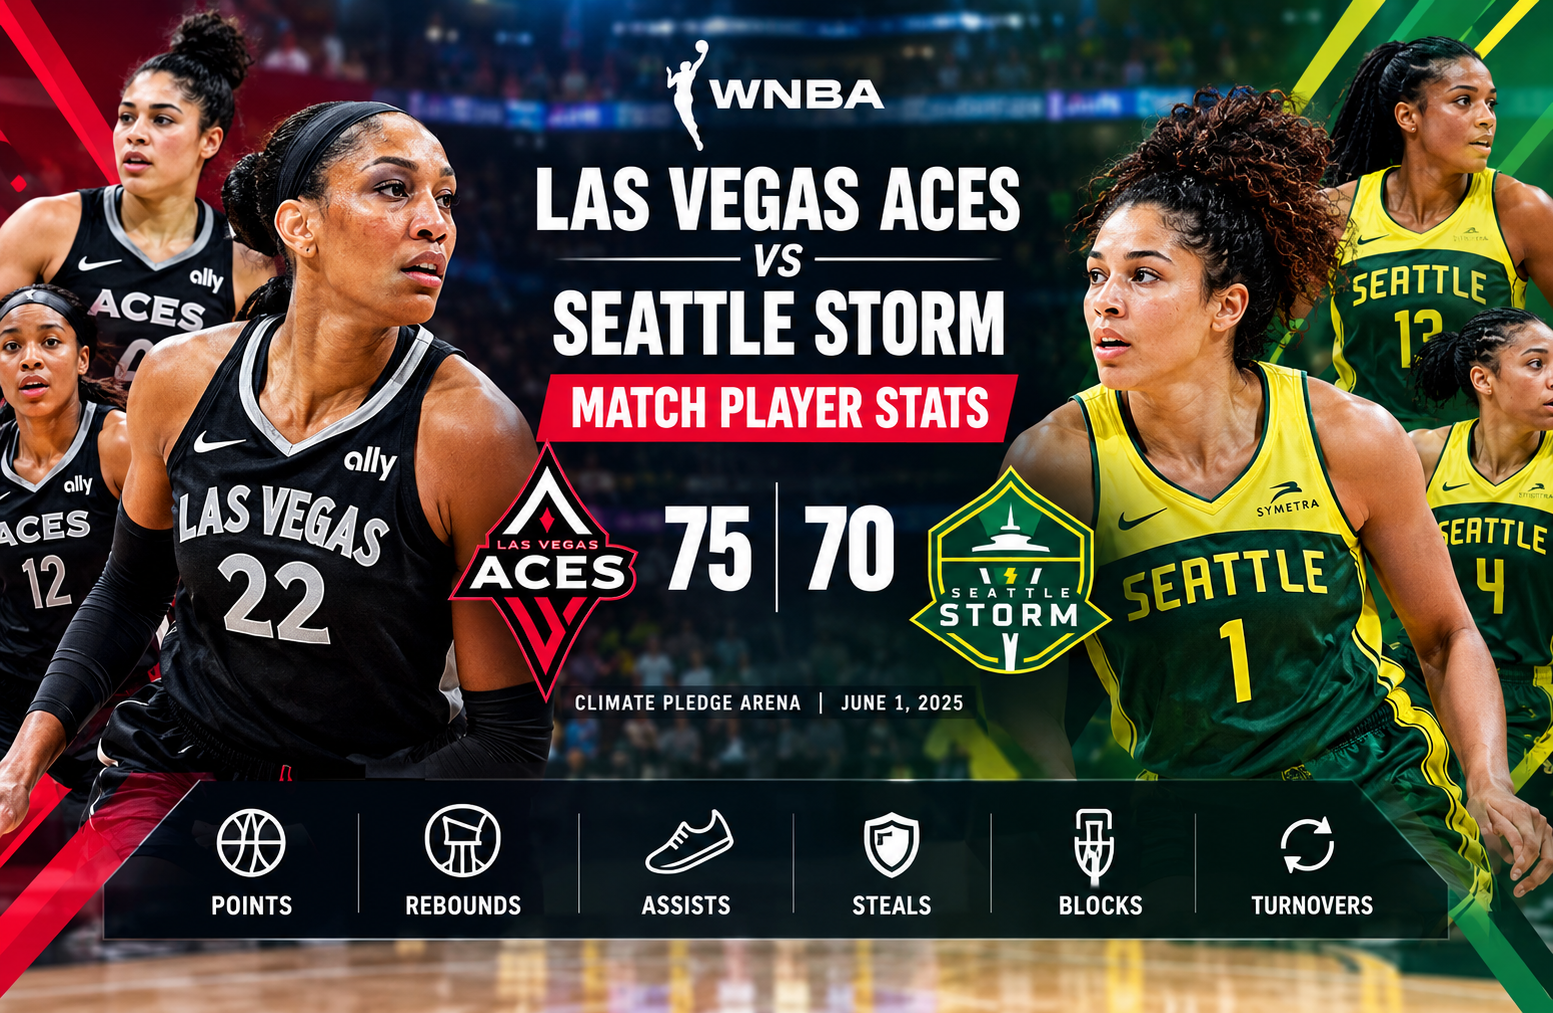
The las vegas aces vs seattle storm match player stats from the 2025 Commissioner’s Cup meeting tell the story of a game that was decided by early control, defensive pressure, and Las Vegas’s ability to withstand Seattle’s late comeback. The Aces won 75-70 at Climate Pledge Arena, building a 17-point advantage before the Storm reduced the gap to three points in the final minute.
The game featured several standout individual performances. A’ja Wilson led Las Vegas with 19 points, seven rebounds, three steals and four blocks according to the detailed box score. Gabby Williams paced Seattle with 20 points, while Ezi Magbegor collected nine rebounds and Skylar Diggins contributed 11 points and five assists. Chelsea Gray controlled the Aces’ offense with six assists, while Jewell Loyd supplied 10 points, seven rebounds and four steals against her former team.
One small date detail is worth clarifying before looking deeper at the numbers. Some databases and feeds display the contest as June 2 because of publication or timezone handling, while the official game information identifies it as Sunday, June 1, 2025, in Seattle. The game was played at Climate Pledge Arena in front of 10,201 fans.
Las Vegas Aces vs Seattle Storm match player stats at a glance
The final score was Las Vegas 75, Seattle 70. The Aces led 27-17 after the opening quarter, 44-32 at halftime, and 61-47 after three quarters. Seattle won the fourth quarter 23-14, but the deficit created earlier was too large to overcome.
| Category | Las Vegas Aces | Seattle Storm |
| Final Score | 75 | 70 |
| Q1 | 27 | 17 |
| Q2 | 17 | 15 |
| Q3 | 17 | 15 |
| Q4 | 14 | 23 |
| Field Goals | 27-64 | 28-65 |
| Field Goal % | 42% | 43% |
| 3-Point Shooting | 10-25 | 8-22 |
| 3-Point % | 40% | 36% |
| Free Throws | 11-14 | 6-7 |
| Free Throw % | 79% | 86% |
| Rebounds | 31 | 32 |
| Assists | 17 | 19 |
| Turnovers | 15 | 19 |
| Steals | 11 | 5 |
| Blocks | 4 | 3 |
| Offensive Rebounds | 6 | 6 |
| Defensive Rebounds | 25 | 26 |
| Fouls | 17 | 16 |
The most important contrast is not field goal percentage. Seattle actually shot slightly better overall at 43% compared with Las Vegas at 42%. The difference was more closely connected to three-point efficiency, turnovers, defensive activity and the way Las Vegas controlled the game during the first three quarters.
What the final score tells us
A five-point final margin can make this look like an evenly balanced contest from start to finish. The quarter-by-quarter numbers tell a different story.
Las Vegas scored 27 points in the first quarter while Seattle managed 17. The Aces then added 17 points in both the second and third quarters. Seattle scored only 15 in each of those periods.
That gave Las Vegas a 14-point advantage entering the fourth.
The Storm then produced the strongest offensive quarter of the game. Seattle scored 23 points in the final period, compared with only 14 for Las Vegas. That nine-point fourth-quarter swing reduced the 14-point gap to five by the final buzzer.
The late rally became particularly dangerous when Seattle cut the deficit to 73-70 with 37.8 seconds remaining. Las Vegas ultimately closed the game without allowing the Storm to complete the comeback. The Seattle Storm’s official recap also highlighted the fourth-quarter 19-7 run that brought the team within three points.
This is one of the most useful lessons from the box score. A final score alone does not show game control. The Aces did not dominate every minute, but they created enough separation early to survive Seattle’s late surge.
A’ja Wilson leads the Aces
A’ja Wilson was the central individual figure in the Las Vegas performance.
She finished with:
- 19 points
- 7 rebounds
- 3 steals
- 4 blocks
- 9-of-22 shooting
- 1-of-2 from three-point range
- 4 offensive rebounds
- 3 defensive rebounds
The scoring total led Las Vegas, while the seven rebounds tied her with Kiah Stokes and Jewell Loyd for the team’s highest total. Her four blocks were also the most in the game. The official statistical record lists her at 34:49 of playing time.
Wilson’s 19 points were not simply about volume. Her defensive contribution was especially important because Seattle had several players capable of attacking from different areas of the floor.
Four blocks from one player changed the geometry of the game. Seattle had to account for Wilson around the basket, while Las Vegas could use that interior presence to create a more aggressive defensive structure.
Her three steals also contributed to the Aces’ 11-5 advantage in steals.
The result was a performance that affected several statistical categories at once rather than simply producing a high scoring number.
Wilson’s shooting efficiency
Wilson attempted 22 field goals and made nine, giving her a 40.9% field goal rate.
That is not an extraordinary shooting percentage by itself, but the overall evaluation changes when her rebounding, blocks and steals are included.
She also did not attempt a free throw in the game, meaning all 19 of her points came from field goals. Her scoring came through a combination of interior opportunities and mid-range shooting, while her defensive numbers gave Las Vegas additional value on the opposite end.
The official box score confirms the 19-point, seven-rebound and four-block line.
Gabby Williams carries Seattle’s scoring load
Gabby Williams was Seattle’s leading scorer with 20 points.
Her line included:
- 20 points
- 4 rebounds
- 2 assists
- 1 steal
- 8-of-16 field goals
- 4-of-8 three-pointers
Her four made three-pointers were particularly significant because Seattle needed perimeter scoring while trying to recover from the early deficit. Williams shot 50% from beyond the arc and 50% overall from the field.
Williams also played 33 minutes, giving Seattle an extended offensive option throughout the contest.
Her fourth-quarter involvement became even more important as Seattle attempted to erase the deficit. The Storm’s official recap noted that Williams had reached double figures in six consecutive games at that point, a career-best streak.
The problem for Seattle was that Williams did not receive enough scoring support early in the game to prevent the Aces from establishing control.
Chelsea Gray’s playmaking mattered
Chelsea Gray scored 10 points, but her six assists may be more important when analyzing the Aces’ offensive structure.
Her complete line included:
- 10 points
- 4 rebounds
- 6 assists
- 6 turnovers
- 3-of-6 shooting
- 2-of-3 from three-point range
- 2-of-2 free throws
Gray’s six assists were the most for either team.
Her three-point shooting was also efficient. She made two of three attempts from deep, helping Las Vegas finish the game at 40% from three-point range.
There was a tradeoff, however. Gray committed six turnovers, which was a major portion of the Aces’ 15 total turnovers.
That is an important distinction when interpreting the las vegas aces vs seattle storm match player stats. A player can be central to offensive creation while simultaneously carrying turnover risk. Gray’s six assists demonstrate her importance as a creator, while her six turnovers show how much responsibility she carried with the ball.
Jewell Loyd makes an impact in her return to Seattle
Jewell Loyd entered this game with an unusual storyline because she had spent her first decade with Seattle before joining Las Vegas.
Against her former team, she recorded:
- 10 points
- 7 rebounds
- 4 assists
- 4 steals
- 2 turnovers
- 3-of-6 shooting
- 2-of-4 three-point shooting
- 2-of-3 free throws
Her four steals tied Wilson for the highest total in the game and helped Las Vegas finish with 11 steals.
Loyd’s contribution was therefore broader than her 10 points suggest.
Seven rebounds from a guard-sized perimeter player added value on the glass. Four assists showed additional playmaking responsibility. Most importantly, four steals gave the Aces another source of defensive disruption.
Her defensive activity was especially relevant because Seattle committed 19 turnovers compared with 15 for Las Vegas.
Jackie Young provides efficient scoring
Jackie Young finished with 12 points, making her the second-highest scorer for Las Vegas.
She shot:
- 4-of-9 from the field
- 1-of-4 from three
- 3-of-4 from the free-throw line
She also recorded four rebounds, one assist and two steals.
Young’s eight first-quarter points were particularly useful as the Aces established their initial lead. The official team release noted that Las Vegas shot 55.6% from the field during the first quarter and 42.9% from three-point range during that period.
That early efficiency helped create the foundation for the eventual win.
Kiah Stokes controls the defensive glass
Kiah Stokes scored only two points, but her seven rebounds were tied for the team lead.
She collected six defensive rebounds and one offensive rebound.
This is an excellent example of why player evaluation should not rely exclusively on points.
Stokes’ role was more defensive and positional. Her rebounding helped Las Vegas limit second opportunities while Wilson could spend more time operating in other areas of the defense.
The Aces finished with 25 defensive rebounds compared with Seattle’s 26. The overall rebounding margin was therefore only one in favor of Seattle, but Las Vegas still prevented the Storm from turning its slight rebounding advantage into a winning possession battle.
Aaliyah Nye provides an important bench contribution
Aaliyah Nye scored 10 points in 11 minutes off the bench.
Her line was:
- 10 points
- 3-of-6 field goals
- 1-of-4 three-pointers
- 3-of-4 free throws
- 1 rebound
The Aces’ official material described the 10-point performance as a career high at the time.
Her contribution is particularly relevant because Las Vegas needed production beyond its established starters.
Nye did not need to dominate possessions. Her role was to convert available opportunities, and 10 points in limited playing time gave the Aces an additional scoring outlet.
Seattle’s supporting cast
Gabby Williams led Seattle with 20 points, but the Storm received contributions across the roster.
Skylar Diggins finished with:
- 11 points
- 4 rebounds
- 5 assists
- 1 steal
- 5-of-15 shooting
- 0-of-3 from three-point range
Her five assists were the most for Seattle.
Nneka Ogwumike contributed:
- 9 points
- 8 rebounds
- 2 assists
- 1 block
- 4-of-13 shooting
Ezi Magbegor added:
- 7 points
- 9 rebounds
- 2 assists
- 1 block
- 3-of-5 shooting
Magbegor’s nine rebounds were the highest total for either team.
Dominique Malonga and Erica Wheeler also became important during Seattle’s late push. Both players scored eight points off the bench, and the Storm’s official recap credited their fourth-quarter production as part of the comeback attempt.
The biggest statistical difference was turnovers
The Aces committed 15 turnovers.
The Storm committed 19.
That four-turnover difference is meaningful in a five-point game.
Seattle’s 19 turnovers also contributed to Las Vegas finishing with 11 steals. The Aces converted those defensive opportunities into pressure without needing a major rebounding advantage.
The NBA game summary also records 21 points off turnovers for Las Vegas compared with 18 for Seattle.
The difference was not enormous, but it was valuable in a close contest.
A useful way to interpret this is that Seattle’s offense was generally capable of matching Las Vegas’s shooting efficiency. What hurt the Storm was the number of possessions that ended before a shot could be generated.
Three-point shooting gave Las Vegas another edge
The Aces made 10 of 25 three-point attempts.
The Storm made eight of 22.
That produced a 40% rate for Las Vegas compared with 36% for Seattle.
The difference was only two made threes, but each successful long-range shot represents three points. In a five-point game, four points of three-point margin becomes meaningful.
Las Vegas also received efficient three-point shooting from Gray and Loyd, while Wilson made one of her two attempts.
Seattle relied heavily on Williams for perimeter production. She made four of eight from three, accounting for half of the Storm’s eight made three-pointers.
This created an interesting contrast. Seattle had the game’s most productive individual three-point shooter, but Las Vegas had more total three-point production.
Seattle shot slightly better overall
One of the more interesting details in the box score is that Seattle finished at 43% from the field while Las Vegas finished at 42%.
Normally, that might suggest Seattle had an offensive advantage.
But shooting percentage is only one component of scoring efficiency.
The Aces attempted 64 field goals and made 27.
The Storm attempted 65 and made 28.
Seattle therefore made one more field goal on one more attempt.
Yet Las Vegas scored 75 points compared with Seattle’s 70.
The explanation includes three-point production and free throws. Las Vegas made 10 three-pointers and 11 free throws, while Seattle made eight threes and six free throws.
The resulting scoring profile favored the Aces despite Seattle’s slightly higher overall field goal percentage.
Free throws also favored Las Vegas in volume
Seattle was more accurate from the line.
The Storm made six of seven attempts for 86%.
Las Vegas made 11 of 14 for 79%.
However, Las Vegas attempted seven more free throws.
That difference produced five additional made free throws for the Aces.
In a five-point game, this is significant. Seattle’s superior free-throw percentage did not translate into more free-throw points because Las Vegas reached the line more often.
The fourth quarter explains the drama
The final period deserves separate attention.
Las Vegas entered the fourth quarter ahead 61-47.
Seattle then scored 23 points.
Las Vegas scored only 14.
The Storm’s 19-7 run cut the deficit from 15 points to three with 37.8 seconds remaining.
That sequence demonstrates two very different aspects of the game.
For Seattle, the fourth quarter showed improved offensive execution and the ability to pressure Las Vegas into a much tighter finish.
For Las Vegas, the same quarter exposed how quickly a comfortable lead can disappear when offensive possessions become less efficient.
The Aces ultimately survived because the early three-quarter advantage was large enough to absorb the late scoring swing.
Why the first quarter mattered so much
Las Vegas scored 27 points in the first quarter.
Seattle scored 17.
The 10-point opening advantage became the foundation of the entire game.
The Aces also forced eight Seattle turnovers during the first quarter, according to the Las Vegas game release. Those turnovers resulted in seven Aces points.
Las Vegas also shot 10-of-18 from the field during the quarter.
That combination of shot-making and defensive pressure gave the Aces immediate control.
Seattle never led after Las Vegas took the advantage at 8:13 of the opening period.
How the teams differed stylistically
The numbers suggest two contrasting approaches.
Las Vegas emphasized defensive disruption
The Aces recorded 11 steals and four blocks.
Wilson was the main rim protector, while Wilson and Loyd each collected four steals.
Las Vegas also forced Seattle into 19 turnovers.
That defensive activity helped compensate for the Storm’s 43% shooting.
Seattle relied on perimeter creation and late pressure
Seattle’s 19 assists were higher than Las Vegas’s 17.
The Storm also shot 43% overall.
Williams supplied four made three-pointers, while Diggins provided five assists.
But Seattle’s 19 turnovers offset some of the benefits of its ball movement.
The Storm therefore had several efficient offensive possessions but also lost too many possessions entirely.
A closer look at possession quality
The game was remarkably close in several traditional categories.
Las Vegas:
- 64 field-goal attempts
- 15 turnovers
- 31 rebounds
- 17 assists
Seattle:
- 65 field-goal attempts
- 19 turnovers
- 32 rebounds
- 19 assists
Seattle actually generated one more field-goal attempt and one more rebound.
The Aces nevertheless won.
That points directly toward the value of turnover management.
The Aces did not win because they controlled every possession category. They won because their defensive pressure produced more disruption, and their perimeter shooting and free-throw volume helped turn those advantages into enough points.
Las Vegas Aces vs Seattle Storm match player stats: the key individual numbers
For readers searching specifically for the player box score, the most relevant figures are below.
Las Vegas Aces
A’ja Wilson: 19 points, 7 rebounds, 3 steals, 4 blocks.
Jackie Young: 12 points, 4 rebounds, 1 assist, 2 steals.
Chelsea Gray: 10 points, 4 rebounds, 6 assists.
Jewell Loyd: 10 points, 7 rebounds, 4 assists, 4 steals.
Kiah Stokes: 2 points, 7 rebounds.
Aaliyah Nye: 10 points off the bench.
Seattle Storm
Gabby Williams: 20 points, 4 rebounds, 2 assists, 1 steal.
Skylar Diggins: 11 points, 4 rebounds, 5 assists, 1 steal.
Nneka Ogwumike: 9 points, 8 rebounds, 2 assists, 1 block.
Ezi Magbegor: 7 points, 9 rebounds, 2 assists, 1 block.
Dominique Malonga: 8 points, 1 rebound, 2 assists.
Erica Wheeler: 8 points, 4 rebounds, 4 assists.
These figures show why the contest cannot be summarized simply as Wilson versus Williams. Both teams received meaningful contributions from multiple players, with Las Vegas getting particularly important defensive production from Wilson and Loyd and Seattle receiving a late boost from its bench.
A historical context for the matchup
The June meeting was part of a closely contested season series.
The WNBA’s 2025 playoff series preview records four regular-season meetings between the teams, with the season series finishing 2-2:
- May 25: Seattle 102, Las Vegas 82
- June 1: Las Vegas 75, Seattle 70
- June 20: Seattle 90, Las Vegas 83
- August 8: Las Vegas 94, Seattle 90
The same WNBA preview noted that three of those four games were decided by seven points or fewer.
That context makes the five-point June result more informative. It was not an isolated competitive matchup. These teams repeatedly produced close games during the 2025 season.
The June 1 contest was also particularly notable because it came only eight days after Seattle had defeated Las Vegas 102-82 at the same arena.
Las Vegas therefore responded with a road win against the same opponent and in the same venue.
What changed from the previous meeting?
The previous Seattle-Las Vegas meeting ended with a 102-82 Storm victory.
The next matchup was very different.
Seattle’s scoring dropped from 102 points to 70.
Las Vegas’s defense played a major role in that change.
The Aces held Seattle to 43% shooting, forced 19 turnovers and collected 11 steals. The earlier meeting had been much more favorable to Seattle’s offensive rhythm.
The June game therefore illustrates why head-to-head results cannot always be interpreted from the final score alone.
Teams can make tactical adjustments, change defensive pressure and alter how they handle specific scorers.
What the stats say about Aces’ defensive identity
The most striking defensive number is the 11 steals.
Four players contributed at least one steal, with Wilson and Loyd each recording four.
Wilson also had four blocks.
Together, those numbers show how much defensive activity came from the Aces’ key players.
Las Vegas did not merely sit back and defend the rim. The team actively disrupted passing lanes and ball handling.
That pressure was particularly effective in the first quarter, when Seattle committed eight turnovers.
The result was an early lead that allowed the Aces to dictate the structure of the game.
What the stats say about Seattle’s resilience
Seattle’s 23-point fourth quarter is equally important.
The Storm did not collapse after falling behind by double digits.
Instead, the team produced its highest-scoring quarter of the game at the moment when the margin mattered most.
Williams remained a major offensive contributor, while Malonga and Wheeler helped drive the late rally.
The Storm eventually got within three points.
That comeback shows why the final five minutes can tell a very different story from the opening 30-plus minutes of a basketball game.
Seattle had enough offensive energy to make the ending competitive, but Las Vegas had already built too large a cushion.
A practical way to read a WNBA box score
For readers who regularly search player statistics, looking beyond points can reveal much more about a game.
A useful five-step approach is:
- Check the scoring leaders. This identifies who carried the offensive load.
- Check shooting efficiency. Compare field goals and three-point percentages.
- Check turnovers and steals. These numbers show how many possessions were lost or created through pressure.
- Check rebounds. Look at both total rebounds and offensive rebounds.
- Check assists and individual defensive statistics. These help identify players whose impact is not reflected by scoring alone.
Using that method for this matchup produces a clear picture.
Wilson was the Aces’ most complete statistical contributor.
Williams was Seattle’s leading scorer.
Gray was the primary Las Vegas playmaker.
Diggins was Seattle’s main assist creator.
Magbegor led all players in rebounds.
Wilson led the game in blocks.
Wilson and Loyd led the game in steals.
That distribution explains the result better than the 75-70 score by itself.
Important limitations when comparing player statistics
Box scores are powerful, but they do not answer every basketball question.
For example, a player with a high assist total may have benefited from teammates making difficult shots. A player with few rebounds may have been responsible for boxing out rather than collecting the ball. A player with several turnovers may also have been handling the ball on nearly every important possession.
That is why the statistics should be read as a collection rather than as isolated numbers.
In this game, Gray’s six turnovers stand out, but so do her six assists.
Williams’ 20 points stand out, but Seattle still lost.
Wilson’s 19 points are important, but her four blocks and three steals show another part of her contribution.
A strong statistical analysis therefore asks not only “Who scored?” but also “How did those contributions affect the possession battle?”
The role of bench production
Bench scoring can become especially important in a close WNBA game.
Las Vegas received 10 points from Aaliyah Nye in limited minutes. Seattle received eight points each from Dominique Malonga and Erica Wheeler.
The difference was not enormous.
However, Las Vegas received its most important bench scoring earlier while Seattle’s reserves became particularly influential during the fourth-quarter rally.
This timing matters.
Production during a comeback can dramatically change the final margin, but production earlier in the game can help create the margin that a team later protects.
The most important numbers from the matchup
Several figures summarize the game particularly well:
75-70: The final score.
27-17: Las Vegas’s first-quarter advantage.
19: A’ja Wilson’s points.
20: Gabby Williams’ points.
11: Las Vegas’s steals.
19: Seattle’s turnovers.
40%: Las Vegas’s three-point percentage.
36%: Seattle’s three-point percentage.
23: Seattle’s fourth-quarter points.
14: Las Vegas’s fourth-quarter points.
10,201: Attendance at Climate Pledge Arena.
These numbers tell a consistent story: Las Vegas built its lead through a strong opening and defensive pressure, while Seattle made the finish much closer through a powerful fourth quarter.
Why the five-point margin can be misleading
A casual look at the final score suggests a close game.
A quarter-by-quarter review shows that the contest was much more one-sided for most of its duration.
Las Vegas led by 12 at halftime and 14 entering the fourth quarter.
Only the final period made the overall margin look narrow.
This is a useful principle when analyzing basketball statistics. A final score is a summary, not a timeline.
The game moved through several phases:
Early phase: Las Vegas controlled the tempo and forced turnovers.
Middle phase: The Aces maintained their advantage while Seattle struggled to cut into the margin.
Late phase: Seattle improved its offense and mounted a serious comeback.
Closing phase: Las Vegas protected the remaining lead.
That sequence is the real story behind the numbers.
Las Vegas Aces vs Seattle Storm match player stats and the season series
The broader 2025 season series reinforces the competitiveness of this matchup.
The WNBA’s postseason preview lists the season series as tied 2-2.
That means neither team had a clear statistical or competitive monopoly over the matchup across the season.
The June contest was particularly notable because it was a road win for Las Vegas following Seattle’s 102-82 victory at the same venue.
The eventual season series also included a Seattle win on June 20 and a Las Vegas win on August 8.
For anyone studying the matchup historically, those four results provide useful context around individual player statistics.
Final statistical assessment
The las vegas aces vs seattle storm match player stats show a game won through multiple small advantages rather than one overwhelming statistical category.
Las Vegas did not dominate shooting percentage.
Seattle had one more rebound.
Seattle had two more assists.
Instead, the Aces gained separation through:
- A 10-point first-quarter advantage
- Better three-point efficiency
- More made free throws
- 11 steals
- Four fewer turnovers
- Four blocks from Wilson
- Strong contributions from Wilson, Young, Gray, Loyd and Nye
Seattle had its own strengths.
The Storm shot 43% from the field, produced 19 assists and scored 23 points in the fourth quarter. Williams was highly efficient from three, Magbegor led all players with nine rebounds, and Diggins supplied five assists.
But the Storm spent too much of the game trying to recover from the opening deficit.
The most useful conclusion from the box score is therefore not simply that Las Vegas won 75-70. It is that the Aces created enough early separation through defensive pressure and efficient perimeter scoring to survive a major fourth-quarter challenge.
For readers comparing player performances, Wilson’s all-around defensive production, Williams’ scoring efficiency, Gray’s playmaking, Loyd’s two-way activity and Magbegor’s rebounding stand among the most informative individual statistics.
The game also demonstrates why a full box score is more valuable than a scoring leaderboard. Points explain who scored, but rebounds, assists, steals, blocks, turnovers and shooting splits explain how the game was actually shaped.
Frequently Asked Questions
What was the final score between the Las Vegas Aces and Seattle Storm?
The Las Vegas Aces defeated the Seattle Storm 75-70 at Climate Pledge Arena.
Who was the top scorer for the Las Vegas Aces?
A’ja Wilson led Las Vegas with 19 points. She also recorded seven rebounds, three steals and four blocks.
Who led the Seattle Storm in scoring?
Gabby Williams led Seattle with 20 points. She made eight of 16 field-goal attempts and four of eight three-point attempts.
Who had the most rebounds in the game?
Ezi Magbegor led all players with nine rebounds for Seattle. Nneka Ogwumike had eight, while A’ja Wilson, Kiah Stokes and Jewell Loyd each had seven for Las Vegas.
Who led the game in assists?
Chelsea Gray led all players with six assists for Las Vegas. Skylar Diggins led Seattle with five assists.
Why did Las Vegas win despite Seattle shooting a higher field-goal percentage?
Seattle shot 43% compared with 42% for Las Vegas, but the Aces made more three-pointers, made more free throws, committed fewer turnovers and recorded more steals. Those advantages helped Las Vegas protect its early lead.
Conclusion
The las vegas aces vs seattle storm match player stats provide a detailed picture of a competitive Commissioner’s Cup game that was shaped by a dominant opening from Las Vegas and a determined late response from Seattle.
A’ja Wilson’s 19-point, seven-rebound and four-block performance gave the Aces a strong two-way foundation. Jackie Young added 12 points, while Chelsea Gray contributed six assists and Jewell Loyd supplied 10 points, seven rebounds and four steals. Aaliyah Nye also provided valuable bench scoring with 10 points.
Seattle received 20 points from Gabby Williams, 11 from Skylar Diggins, nine from Nneka Ogwumike and seven from Ezi Magbegor. Magbegor’s nine rebounds led the game, while Diggins’ five assists helped Seattle generate offensive opportunities.
The team statistics reveal the larger story. Seattle shot slightly better overall and collected one more rebound, but Las Vegas made 10 three-pointers, recorded 11 steals and committed four fewer turnovers. The Aces also built a 27-17 first-quarter lead that ultimately proved decisive.
Seattle’s 23-point fourth quarter transformed what looked like a comfortable Las Vegas victory into a five-point finish. The Storm’s late 19-7 run brought the score to 73-70 with 37.8 seconds remaining, but Las Vegas made the plays necessary to close the game.
For anyone studying this matchup, the key lesson is that the final score alone does not capture the complete performance. The combination of player-level production, shooting efficiency, turnovers, defensive activity and quarter-by-quarter scoring provides a much clearer explanation of how Las Vegas secured the 75-70 victory.
The season context is also important. The WNBA’s 2025 playoff preview records the regular-season series between the two teams as tied 2-2, with three of the four meetings decided by seven points or fewer.





One Comment