Phoenix Suns vs Detroit Pistons Match Player Stats
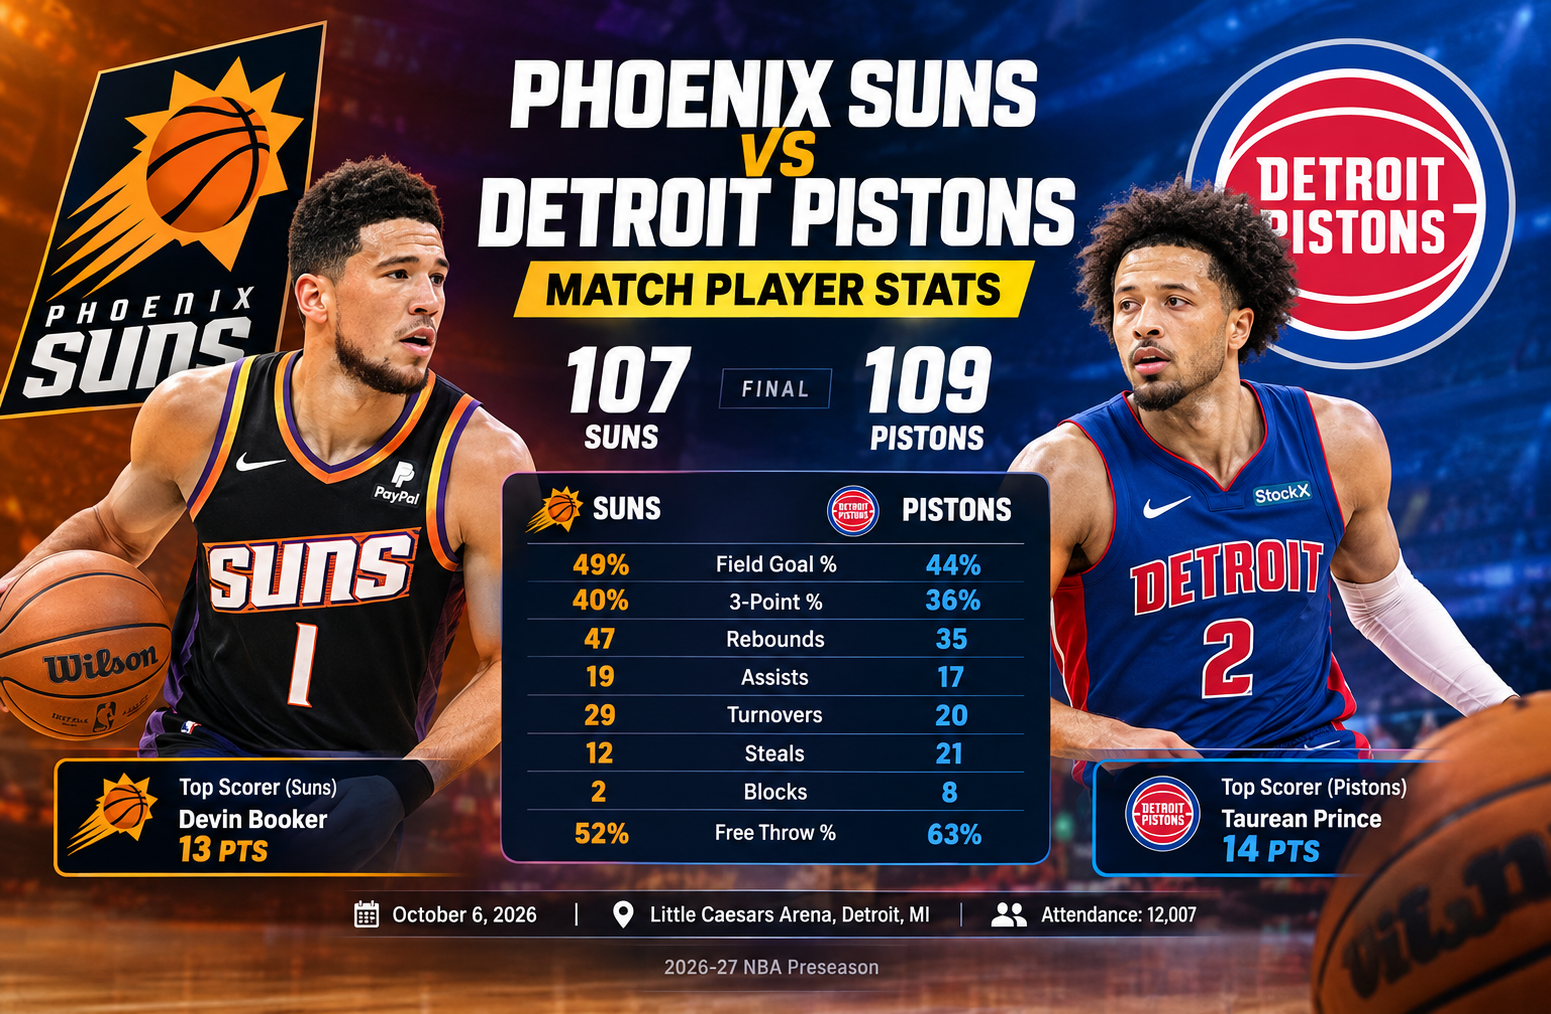
Phoenix Suns vs Detroit Pistons match player stats from the October 6, 2026 preseason matchup provide a useful look at how Detroit escaped with a 109-107 victory at Little Caesars Arena. The final margin was only two points, but the box score tells a more interesting story. Phoenix shot better from the field and from three-point range, while Detroit created a major defensive advantage through steals, blocks, and free-throw opportunities.
The game was played at Little Caesars Arena in Detroit, Michigan, with an attendance of 12,007. Detroit finished with a 109-107 win, giving the Pistons a positive start to their preseason schedule. Phoenix, meanwhile, left with several areas to evaluate, especially ball security, defensive pressure, and free-throw efficiency.
One important point for readers is that this was a preseason contest rather than a regular-season game. That distinction matters when evaluating player statistics because coaches often limit minutes, test different combinations, and prioritize experimentation over winning. ESPN’s game reporting confirms that several starters, including Cade Cunningham and Duncan Robinson, played limited minutes.
Game Overview
The Phoenix Suns entered the matchup looking to evaluate a new-look rotation, while Detroit used the contest to test its own lineup combinations and defensive identity.
The final result was:
| Team | Final Score |
| Detroit Pistons | 109 |
| Phoenix Suns | 107 |
Detroit’s two-point victory came despite Phoenix holding several statistical advantages.
Phoenix finished 38-of-78 from the field, good for 49 percent shooting. Detroit made 35 of 79 attempts, or 44 percent. Phoenix also connected on 14 of 35 three-point attempts for 40 percent, while Detroit went 13-of-36 from beyond the arc for 36 percent.
On the surface, those numbers suggest Phoenix should have had a better chance to win.
The difference came elsewhere.
Detroit forced 29 Phoenix turnovers while committing only 20 of its own. The Pistons also recorded 21 steals compared with 12 for Phoenix and blocked eight shots compared with only two for the Suns.
That defensive activity created extra opportunities and helped compensate for Detroit’s lower shooting percentages.
Phoenix also struggled at the free-throw line. The Suns went 17-of-33, or approximately 52 percent. Detroit shot 26-of-41, or approximately 63 percent.
In a two-point game, those details matter.
Phoenix Suns vs Detroit Pistons Match Player Stats: What the Box Score Reveals
The most useful way to read this game is not simply to identify the leading scorer.
A box score should be treated as a collection of connected signals.
Phoenix had the better overall shooting percentage. Detroit had the better turnover profile. Phoenix had more rebounds and assists, but Detroit generated significantly more defensive events.
Here is the main team comparison:
| Category | Phoenix Suns | Detroit Pistons |
| Points | 107 | 109 |
| Field Goals | 38-78 | 35-79 |
| Field Goal % | 49% | 44% |
| 3-Point Field Goals | 14-35 | 13-36 |
| 3-Point % | 40% | 36% |
| Free Throws | 17-33 | 26-41 |
| Free Throw % | 52% | 63% |
| Rebounds | 47 | 35 |
| Assists | 19 | 17 |
| Turnovers | 29 | 20 |
| Steals | 12 | 21 |
| Blocks | 2 | 8 |
This is a classic example of why shooting percentage alone does not determine a basketball game.
Phoenix converted shots more efficiently, but Detroit generated more disruptive defensive possessions.
Phoenix’s shooting efficiency was a positive
Shooting 49 percent from the field is generally a strong offensive foundation.
The Suns also made 40 percent of their three-point attempts. That combination indicates that Phoenix was capable of producing efficient scoring possessions when it avoided mistakes.
The problem was that those efficient possessions were offset by turnovers and missed free throws.
Detroit’s defensive pressure changed the game
Twenty-one steals is the number that immediately stands out.
Detroit’s 21 steals were nine more than Phoenix’s 12. The Pistons also recorded eight blocks, six more than Phoenix.
Those numbers point toward an aggressive defensive performance.
Even when Detroit did not shoot efficiently, its defense created additional possessions and disrupted Phoenix’s offensive rhythm.
That is especially important in preseason basketball, where coaches often want to see how players respond to pressure rather than simply running their most reliable half-court sets.
Devin Booker Led Phoenix in Scoring
Devin Booker finished as Phoenix’s top scorer with 13 points.
That total is modest by Booker’s normal scoring standards, but the context matters. This was a preseason game, and the primary purpose of the contest was evaluation rather than maximizing the minutes of established players.
Phoenix’s listed starters included:
- Devin Booker: 13 points
- Dillon Brooks: 11 points
- Miles Bridges: 8 points
- Oso Ighodaro: 3 points
- Jalen Green: 11 points
Booker’s 13 points made him Phoenix’s leading scorer, but the more interesting question is what the Suns can learn from the distribution of production.
The starting group did not carry the entire offensive burden for a full regular-season workload. That means the raw scoring totals should not be interpreted as projections for the season.
Instead, the game gives an early look at how Phoenix may distribute responsibilities.
Jalen Green and Dillon Brooks Add Secondary Scoring
Jalen Green and Dillon Brooks each finished with 11 points.
That creates a useful secondary scoring layer around Booker.
For Phoenix, the value of having multiple players capable of reaching double figures is not simply about the total number of points. It is about preventing opponents from loading up on one primary offensive creator.
If Booker draws aggressive defensive attention, Phoenix needs other players who can attack closeouts, create shots, or punish defenders for overcommitting.
Brooks also brings a different offensive profile from Booker. His value is not limited to scoring because his physical perimeter defense can affect the game in ways that do not appear directly in the scoring column.
Green’s role is particularly important because his scoring ability can change the spacing and pace of Phoenix’s offense.
The preseason is an appropriate environment for testing how those pieces fit together.
Miles Bridges Provides More Than Eight Points
Miles Bridges scored eight points in the game.
That number is not particularly eye-catching, but ESPN’s player reporting provides additional context. Bridges finished with five rebounds, four assists, and one steal while playing limited minutes.
That is a good example of why a player-stat article should go beyond the leading scorer.
Eight points alone suggests a quiet offensive night.
Eight points combined with five rebounds and four assists tells a different story.
Bridges showed that his potential contribution can extend into rebounding and secondary playmaking. In a rotation that includes multiple scoring options, that versatility can become valuable.
A player does not need to score 20 points to have a positive offensive impact.
Taurean Prince Led Detroit With 14 Points
Taurean Prince was Detroit’s leading scorer with 14 points.
Unlike Phoenix, Detroit had five listed starters in double figures:
- Taurean Prince: 14 points
- John Collins: 10 points
- Paul Reed: 10 points
- Cade Cunningham: 10 points
- Ausar Thompson: 10 points
Duncan Robinson added nine points.
That distribution is significant because Detroit did not rely on one dominant scoring performance.
Instead, the Pistons received balanced production across the lineup.
Balanced scoring can be especially useful in preseason basketball because coaches are evaluating role players and rotation combinations. A team that can maintain offensive production while changing personnel has more flexibility when the regular season arrives.
Cade Cunningham’s Ten Points Need Context
Cade Cunningham finished with 10 points.
At first glance, that number may seem underwhelming for a player expected to be central to Detroit’s offense.
However, the context is essential.
ESPN reported that Cunningham played only the first half as Detroit limited his workload in the preseason opener. He finished with 10 points, two rebounds, one assist, and one steal in 16 minutes.
That makes his 10-point total far less concerning than it would be in a full regular-season game.
Preseason statistics should always be connected to playing time.
A player scoring 10 points in 16 minutes has a different statistical context from a player scoring 10 points in 36 minutes.
For Detroit, the more important takeaway is that Cunningham was able to participate in the team’s first preseason test without being asked to carry a full workload.
Ausar Thompson’s Defensive Impact Stands Out
Ausar Thompson scored 10 points and added three steals, two rebounds, two assists, and one block.
That statistical line is one of the more interesting individual performances from the Detroit side.
Thompson’s value was not dependent on scoring.
His three steals and one block directly contributed to Detroit’s defensive pressure. ESPN also highlighted that he finished with four combined steals and blocks in limited minutes.
When combined with Detroit’s 21 total steals and eight blocks, Thompson’s contribution fits into a larger team pattern.
The Pistons were not simply trying to outshoot Phoenix.
They were creating defensive events.
That distinction may be one of the most useful takeaways from this game.
Paul Reed Gives Detroit Interior Production
Paul Reed finished with 10 points.
His performance included seven rebounds, three assists, one steal, and one block in 21 minutes, according to ESPN.
That is a productive all-around line for a player operating in a preseason rotation.
Reed’s seven rebounds were particularly useful because Detroit finished with only 35 total rebounds compared with Phoenix’s 47.
Phoenix had the overall rebounding advantage, but Reed still provided Detroit with strong individual work on the glass.
His six-of-six free-throw shooting also helped Detroit’s overall efficiency at the line.
Duncan Robinson Provides Efficient Shooting
Duncan Robinson scored nine points.
His total may look modest, but his shooting efficiency was notable.
ESPN reported that Robinson went three-of-four from the field and three-of-three from three-point range in 13 minutes.
That means all three of his made field goals came from beyond the arc.
For a team building around a primary creator such as Cunningham, perimeter spacing can be extremely important.
A shooter who forces defenders to stay attached can create driving lanes for other players without needing a high volume of shots.
Robinson’s nine points therefore tell only part of the story.
The Biggest Statistical Difference Was Turnovers
The clearest advantage for Detroit was turnover creation.
Phoenix committed 29 turnovers.
Detroit committed 20.
That nine-turnover difference is enormous in a game decided by two points.
It means Phoenix gave Detroit many more opportunities to end possessions without a shot attempt.
Detroit also recorded 21 steals.
Those numbers are closely connected.
The Pistons’ defensive pressure did not simply prevent Phoenix from scoring. It also created extra offensive opportunities.
This is one of the most important lessons from the matchup.
When two teams shoot 49 percent and 44 percent respectively, the lower-turnover team can still win because possession volume matters.
Basketball is not simply about how efficiently a team shoots.
It is also about how often it gets a chance to shoot.
Phoenix Won the Rebounding Battle
Phoenix grabbed 47 rebounds compared with 35 for Detroit.
That is a 12-rebound advantage.
Ordinarily, such a margin would be a major positive indicator.
Phoenix’s advantage on the glass helped the Suns maintain possession and limit some second-chance opportunities for Detroit.
However, the rebounding advantage was not enough to overcome the turnover difference.
This is another reason the game is useful for statistical analysis.
The Suns won one of the most visible possession categories but lost another.
The final result came from the combination.
Phoenix Also Had More Assists
Phoenix recorded 19 assists.
Detroit finished with 17.
The two-point difference is relatively small, but it suggests Phoenix did a reasonable job generating assisted scoring opportunities.
The Suns also had the better shooting percentages.
This reinforces the idea that Phoenix’s offensive process was not entirely poor.
The bigger issue was possession security.
A team can move the ball effectively and still lose if too many possessions end with turnovers.
That appears to be one of the clearest areas Phoenix can examine from this matchup.
Free Throws Were Another Major Factor
Phoenix went 17-of-33 at the free-throw line.
Detroit went 26-of-41.
Neither team was especially efficient, but Detroit had 41 attempts compared with Phoenix’s 33.
The Pistons also made nine more free throws.
In a two-point game, that is a major difference.
Free throws are often overlooked when people focus on field-goal percentage, but they can decide close contests because they provide scoring opportunities without requiring a field-goal attempt.
Detroit’s advantage in both attempts and makes helped offset its lower field-goal percentage.
For Phoenix, free-throw efficiency is an obvious area to monitor.
Shooting 52 percent from the line is too inefficient to ignore, even in preseason.
Why Detroit Won Despite Shooting 44 Percent
The final score becomes easier to understand when the statistical pieces are placed together.
Detroit:
- Forced more turnovers.
- Recorded more steals.
- Recorded more blocks.
- Attempted more free throws.
- Made more free throws.
- Received balanced scoring from its starting group.
Phoenix:
- Shot a higher field-goal percentage.
- Shot a higher three-point percentage.
- Collected more rebounds.
- Recorded more assists.
- Committed nine more turnovers.
- Shot only 52 percent from the free-throw line.
That is why the two-point final margin is more informative than the raw shooting percentages.
Detroit won the possession battle in the areas that mattered most.
A Closer Look at the Defensive Numbers
Detroit’s 21 steals and eight blocks combine for 29 recorded steals-plus-blocks.
Phoenix had 12 steals and two blocks, totaling 14.
That means Detroit produced 15 more recorded defensive events of those two types.
This is not a complete measurement of defensive quality, but it is a strong indicator of how disruptive the Pistons were.
The Suns still managed to shoot 49 percent, which shows that Detroit’s pressure did not completely shut down Phoenix’s offense.
Instead, the Pistons created enough disruption to compensate for allowing relatively efficient shooting.
That is an important distinction.
A defense does not always need to prevent made shots.
Sometimes it can win by preventing clean possessions from happening in the first place.
What the Matchup Says About Phoenix
The biggest positive for Phoenix was offensive efficiency.
A 49 percent field-goal rate and 40 percent three-point rate are encouraging.
The Suns also won the rebounding battle by 12 and finished with slightly more assists.
Those are useful foundations.
The concerns are just as clear.
Twenty-nine turnovers is the largest issue.
A team can survive inefficient shooting when it protects the ball. It becomes much harder when it combines turnovers with poor free-throw shooting.
Phoenix therefore has several obvious areas to monitor as preseason continues:
- Ball security
- Free-throw efficiency
- Half-court execution under pressure
- Handling aggressive perimeter defense
- Maintaining offensive efficiency without excessive turnovers
The game should not be treated as a prediction of Phoenix’s regular-season performance.
Instead, it is an early diagnostic.
What the Matchup Says About Detroit
Detroit’s biggest positive was defensive activity.
The Pistons forced turnovers, collected steals, blocked shots, and generated enough free-throw opportunities to overcome their lower shooting percentage.
Balanced scoring was another positive.
Five listed starters reached double figures, while Robinson contributed nine points with excellent three-point efficiency.
The biggest question is whether that defensive pressure can translate into consistent regular-season possessions.
Preseason games often contain unusual lineups and experimental rotations, so the numbers should be interpreted carefully.
Still, the basic formula is promising.
Detroit did not need to shoot exceptionally well to win.
The Pistons found other ways to create an advantage.
Why Preseason Context Matters
It would be misleading to treat every statistic from this game as a regular-season projection.
Preseason basketball has different objectives.
Coaches may:
- Limit established players’ minutes
- Test inexperienced players
- Change starting combinations
- Experiment with defensive schemes
- Give reserves extended opportunities
- Reduce workloads after halftime
- Evaluate players in unfamiliar roles
Cunningham’s 16-minute appearance is a clear example.
Robinson also played only 13 minutes, according to ESPN.
That means readers should focus more on role indicators than on raw scoring totals.
A 10-point performance can be encouraging or disappointing depending on minutes, usage, efficiency, and responsibilities.
The Most Important Player Takeaways
Several individual performances deserve particular attention.
Devin Booker
Booker led Phoenix with 13 points. His scoring total was not large, but his presence gives Phoenix a reliable primary offensive option.
Jalen Green
Green’s 11 points provided Phoenix with another double-digit scoring source.
Dillon Brooks
Brooks also scored 11 points and gives Phoenix a physical perimeter option capable of contributing on both ends.
Miles Bridges
Bridges scored eight points but added five rebounds, four assists, and one steal in limited minutes. That all-around production is worth noting.
Taurean Prince
Prince led Detroit with 14 points and was the team’s top scorer.
Cade Cunningham
Cunningham scored 10 points in only 16 minutes, making his production difficult to compare directly with players who received longer workloads.
Ausar Thompson
Thompson’s 10 points, three steals, two assists, two rebounds, and one block highlighted his two-way potential.
Paul Reed
Reed produced 10 points and seven rebounds while shooting six-of-six from the free-throw line.
Duncan Robinson
Robinson’s nine points came with three made three-pointers in four field-goal attempts, making him one of Detroit’s most efficient shooters in the game.
Phoenix Suns vs Detroit Pistons Match Player Stats: Key Lessons
The central lesson from the game is that statistical efficiency has multiple layers.
Phoenix was more efficient from the field.
Detroit was more efficient at converting free throws.
Phoenix rebounded better.
Detroit protected the ball better.
Phoenix recorded more assists.
Detroit produced more steals and blocks.
Those differences explain why a team can lose despite shooting better.
For readers analyzing basketball statistics, this is exactly why looking at only points and field-goal percentage can lead to an incomplete conclusion.
The best analysis asks how the points were created.
What Fans Should Watch in the Next Games
For Phoenix, the next useful checkpoint is whether the team can reduce turnovers while maintaining its shooting efficiency.
If Phoenix continues to shoot around this level but cuts down on empty possessions, its offensive profile becomes much more attractive.
Detroit should be watched for defensive consistency.
The Pistons generated 21 steals and eight blocks in this contest. The question is whether that level of disruption continues against different lineups and more established regular-season rotations.
Cunningham’s workload will also be important to monitor.
His 10-point performance came in only 16 minutes, so future preseason games should provide a better understanding of how Detroit intends to balance his workload with that of the rest of the roster.
How to Read These Player Stats Correctly
A good player-stat analysis should consider at least five factors:
1. Scoring
Points remain important, but they should not be considered alone.
2. Efficiency
Field-goal percentage, three-point percentage, and free-throw percentage reveal how effectively a player converts opportunities.
3. Possession Impact
Turnovers, offensive rebounds, and defensive events influence how many possessions a team receives.
4. Playmaking
Assists can show whether a player contributes to creating efficient opportunities for teammates.
5. Context
Minutes, preseason status, lineup combinations, and coaching decisions can completely change how a statistic should be interpreted.
This final factor is especially important in this matchup.
Data Quality Note
There is an important discrepancy in the supplied game data that should be acknowledged rather than silently repeated.
The provided quarter-score sequence for Phoenix is 21, 35, 33, 16, and 23, while Detroit’s sequence is 29, 21, 29, 34, and 25. Those numbers do not reconcile with the stated final score of Detroit 109, Phoenix 107.
Because the final score and player/team totals are the central data points, this article does not use those quarter figures to calculate scoring trends.
The final result of 109-107 and the major player and team statistics are used as the basis for the analysis. ESPN’s reporting independently confirms Detroit’s 109-107 preseason victory and several of the individual performances.
This is an important editorial practice for sports-stat content: when a supplied data field conflicts with the final result, it is better to disclose the conflict than to manufacture a narrative from inconsistent numbers.
Frequently Asked Questions
Who won the Phoenix Suns vs Detroit Pistons game?
The Detroit Pistons defeated the Phoenix Suns 109-107 in the October 6, 2026 preseason matchup at Little Caesars Arena.
Who was the top scorer for the Phoenix Suns?
Devin Booker led Phoenix with 13 points.
Who led the Detroit Pistons in scoring?
Taurean Prince was Detroit’s leading scorer with 14 points.
What was the biggest statistical difference between the teams?
Turnovers were one of the biggest differences. Phoenix committed 29 turnovers compared with 20 for Detroit. Detroit also recorded 21 steals compared with 12 for Phoenix.
Which team shot better?
Phoenix shot better from the field and from three-point range. The Suns shot 49 percent overall and 40 percent from three, while Detroit shot 44 percent overall and 36 percent from three.
Was this a regular-season NBA game?
No. The October 6, 2026 matchup was a preseason game. This matters because several players received limited minutes, making direct comparisons with regular-season performances less reliable.
Conclusion
The Phoenix Suns vs Detroit Pistons match player stats show why the final score cannot be understood through shooting percentages alone.
Phoenix shot 49 percent from the field and 40 percent from three-point range, while also winning the rebounding battle 47-35. Those were clear positives for the Suns.
Detroit, however, created a different kind of advantage.
The Pistons recorded 21 steals, eight blocks, committed nine fewer turnovers, and made nine more free throws. Those possession and defensive advantages helped Detroit overcome its lower shooting percentages and secure a 109-107 victory.
Individually, Taurean Prince led Detroit with 14 points, while Devin Booker led Phoenix with 13. Cade Cunningham scored 10 points in a limited 16-minute appearance, while Ausar Thompson and Paul Reed provided important all-around contributions. Duncan Robinson also displayed excellent perimeter efficiency by making three of his four field-goal attempts and all three of his three-point attempts.
For Phoenix, the main statistical lesson is clear: the team’s shooting efficiency was encouraging, but 29 turnovers and 52 percent free-throw shooting created a difficult path to victory.
For Detroit, the defensive pressure and balanced scoring were the strongest takeaways.
Because this was a preseason game, the statistics should be viewed primarily as early evidence of player roles, lineup experimentation, and team tendencies rather than as definitive predictions for the 2026-27 regular season.