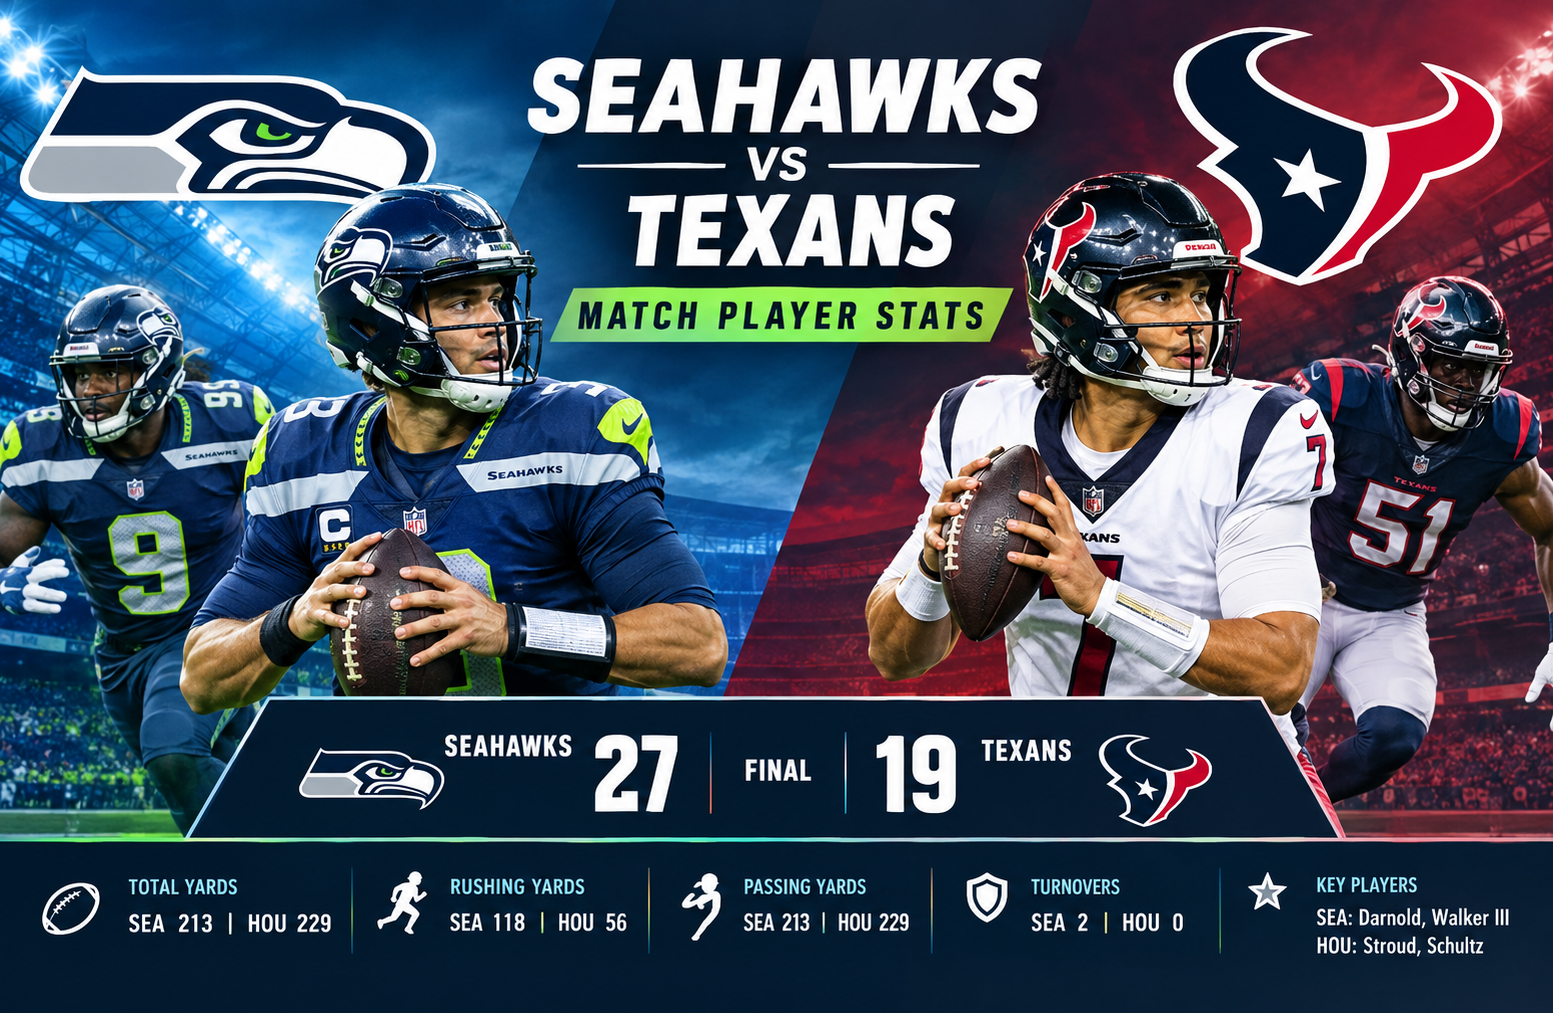
Seahawks vs Texans Match Player Stats
The seahawks vs texans match player stats from the October 20, 2025 matchup tell a much more detailed story than the final 27-19 score suggests. Seattle defeated Houston at Lumen Field after building a 14-0 first-quarter lead, extending that advantage to 27-12 in the third quarter, and then holding off a late Texans touchdown. The result moved Seattle to 5-2 while Houston fell to 2-4. (ESPN)
For anyone studying the seahawks vs texans match player stats, the most important numbers are not limited to passing yards or touchdowns. Seattle gained 316 total yards compared with Houston’s 254, produced 118 rushing yards against 56, recorded 12 passes defended, and forced four Houston turnovers. Houston had only one turnover, while Seattle lost two fumbles and threw two interceptions. (ESPN)
The individual numbers also explain how the game developed. Jaxon Smith-Njigba led Seattle with 123 receiving yards and a touchdown, Zach Charbonnet scored twice on the ground, Kenneth Walker III carried the ball 17 times for 66 yards, and Ernest Jones IV delivered an interception while making a game-high tackle total according to the official game reporting. (ESPN)
Seahawks vs Texans Match Player Stats
The matchup took place in Seattle, with the Seahawks entering the game at 4-2 and Houston at 2-3. After the final whistle, Seattle improved to 5-2, while Houston moved to 2-4. The Seahawks won 27-19, scoring 14 points in the first quarter and 13 in the third. Houston scored six points in both the second and third quarters before adding its only offensive touchdown in the fourth. (ESPN)
Final Score and Quarter Breakdown
| Team | Q1 | Q2 | Q3 | Q4 | Final |
| Houston Texans | 0 | 6 | 6 | 7 | 19 |
| Seattle Seahawks | 14 | 0 | 13 | 0 | 27 |
Seattle’s scoring pattern was important. The Seahawks established control early, went scoreless in the second quarter, then produced 13 points in the third quarter to create enough separation for the final period.
Houston’s offense did not record its first touchdown until late in the fourth quarter. C.J. Stroud found Woody Marks for a four-yard touchdown with 2:04 remaining, but the Texans could not complete the comeback. (ESPN)
Quarter-by-Quarter Game Analysis
First Quarter: Seattle Takes Control
Seattle opened the game with an aggressive combination of running and short passing. The Seahawks eventually produced a 14-point first quarter, while Houston was held scoreless.
Zach Charbonnet scored the opening touchdown on a short rushing attempt. The scoring opportunity followed a major defensive play by Uchenna Nwosu, who sacked C.J. Stroud for an 18-yard loss and pushed Houston deep into its own territory. (ESPN)
Seattle then extended the advantage through Jaxon Smith-Njigba. Sam Darnold connected with Smith-Njigba for an 11-yard touchdown, giving Seattle a 14-0 lead.
The early deficit affected Houston’s offensive rhythm. Stroud was repeatedly placed in difficult down-and-distance situations, and Seattle’s defensive front was able to create pressure without needing Houston to fall far behind on the scoreboard first.
Second Quarter: Houston Stops the Bleeding
Houston responded in the second quarter with two field goals from Ka’imi Fairbairn, but Seattle’s defense prevented the Texans from finding the end zone.
Fairbairn finished 2-for-2 on field-goal attempts and scored seven total points. Seattle kicker Jason Myers also contributed, finishing 2-for-3 on field goals and 3-for-3 on extra points.
The second quarter therefore became a defensive and field-position battle rather than a major offensive exchange.
Third Quarter: Seattle Rebuilds Its Lead
The third quarter was decisive.
Ernest Jones IV intercepted Stroud early in the period, returning the ball 28 yards. Jones also recorded 11 tackles in the supplied statistical data, while the NFL’s game report credited him with 12 total tackles. The difference reflects the way defensive tackle statistics can vary slightly between sources, so readers comparing box scores should use the official game record for the final defensive total. (ESPN)
Seattle converted the turnover into points and increased its lead.
Charbonnet then scored his second rushing touchdown of the night, helping Seattle reach a 27-12 advantage.
Houston did get a defensive touchdown during this stretch. Sam Darnold was strip-sacked in his own end zone, and Texans edge rusher Will Anderson Jr. recovered the fumble for a touchdown. Houston failed to convert the subsequent two-point attempt. (ESPN)
Fourth Quarter: Houston Scores, Seattle Closes the Game
Houston finally produced its only offensive touchdown with 2:04 left.
Stroud completed a four-yard touchdown pass to Woody Marks, cutting the deficit to eight points after the extra point.
The Texans then needed a defensive stop and another scoring possession. Seattle instead used its running game to drain the remaining clock.
Charbonnet carried the ball on several late-game plays before Seattle quarterback Sam Darnold took kneel-downs to finish the contest.
That sequence illustrates an important point when studying game statistics. A team’s total offensive production does not necessarily tell you how effectively it managed the final minutes. Seattle’s ability to use its running game after Houston scored was an important part of closing out the victory.
C.J. Stroud Passing Stats
C.J. Stroud completed 23 of 49 passes for 229 yards, one touchdown, and one interception. His listed passer rating was 59.0, with a QBR of 28.5.
| Statistic | C.J. Stroud |
| Completions | 23 |
| Attempts | 49 |
| Completion Rate | 46.9% |
| Passing Yards | 229 |
| Yards per Attempt | 4.7 |
| Touchdowns | 1 |
| Interceptions | 1 |
| Sacks | 3 |
| Sack Yards Lost | 31 |
| QBR | 28.5 |
| Passer Rating | 59.0 |
The completion percentage was one of the clearest indicators of Houston’s offensive difficulty.
Stroud attempted 49 passes but averaged only 4.7 yards per attempt. That combination indicates volume without consistent downfield efficiency.
The pressure also mattered. Seattle recorded three sacks for 31 yards, while NFL reporting noted that the Seahawks pressured Stroud on 31.5% of his dropbacks. (NFL)
Stroud did make several productive throws late in the game, particularly to Dalton Schultz and Jaylin Noel. However, the Texans struggled to convert those opportunities into sustained scoring drives.
Sam Darnold Passing Stats
Sam Darnold completed 17 of 31 passes for 213 yards, one touchdown, and one interception. His listed passer rating was 73.7 and his QBR was 44.8.
| Statistic | Sam Darnold |
| Completions | 17 |
| Attempts | 31 |
| Completion Rate | 54.8% |
| Passing Yards | 213 |
| Yards per Attempt | 6.9 |
| Touchdowns | 1 |
| Interceptions | 1 |
| Sacks | 2 |
| Sack Yards Lost | 15 |
| QBR | 44.8 |
| Passer Rating | 73.7 |
Darnold’s passing line was not flawless. His interception and the lost fumble in the third quarter created opportunities for Houston.
However, his 6.9 yards per attempt was considerably higher than Stroud’s 4.7.
Seattle’s passing attack also benefited from the performance of Smith-Njigba, who repeatedly created meaningful gains after the catch and on intermediate routes.
Darnold’s most important contribution was therefore not simply his raw passing total. It was his ability to generate enough explosive production through his primary receiving target while Seattle’s rushing attack handled the scoring workload.
Cooper Kupp’s Passing Attempt
Cooper Kupp also appeared in the passing statistics because he attempted one pass.
He finished 0-for-1 with one interception.
That play had a major statistical effect on Seattle’s team passing line. Darnold’s individual passing statistics remained 17-for-31 with one interception, while the Seattle team passing line became 17-for-32 with two interceptions.
Kupp otherwise contributed as a receiver, catching one pass for 32 yards.
This is a useful distinction for readers who compare player statistics with team statistics. A trick-play passing attempt can change the team turnover total without representing the quarterback’s individual passing line.
Seattle Rushing Statistics
Seattle ran the ball 33 times for 118 yards and two touchdowns.
| Player | Carries | Yards | Average | TD | Long |
| Kenneth Walker III | 17 | 66 | 3.9 | 0 | 16 |
| Zach Charbonnet | 12 | 49 | 4.1 | 2 | 15 |
| AJ Barner | 1 | 2 | 2.0 | 0 | 2 |
| Sam Darnold | 3 | 1 | 0.3 | 0 | 3 |
| Team | 33 | 118 | 3.6 | 2 | 16 |
Kenneth Walker III led Seattle in rushing attempts and rushing yards.
His 17 carries for 66 yards provided the workload foundation for Seattle’s ground game.
Charbonnet was more productive on a per-carry basis and, most importantly, scored both of Seattle’s rushing touchdowns.
That combination gave Seattle two complementary rushing roles. Walker provided volume, while Charbonnet provided the finishing production.
Zach Charbonnet’s Two-Touchdown Performance
Charbonnet was one of the most important players in the game from a scoring perspective.
He finished with:
- 12 rushing attempts
- 49 rushing yards
- 4.1 yards per carry
- 2 rushing touchdowns
- 15-yard longest run
- 2 receptions
- 6 receiving yards
His first touchdown helped Seattle establish the early 7-0 advantage.
His second rushing touchdown came in the third quarter and extended Seattle’s lead to 27-12.
The value of his performance was therefore tied closely to game context. Charbonnet did not need 100 rushing yards to become a major factor because his carries were converted into points at critical moments.
Houston Rushing Statistics
Houston finished with only 56 rushing yards on 17 attempts.
| Player | Carries | Yards | Average | TD | Long |
| C.J. Stroud | 2 | 25 | 12.5 | 0 | 15 |
| Nick Chubb | 5 | 16 | 3.2 | 0 | 5 |
| Woody Marks | 10 | 15 | 1.5 | 0 | 11 |
| Team | 17 | 56 | 3.3 | 0 | 15 |
The unusual feature of Houston’s rushing table is that Stroud led the team in rushing yards despite carrying the ball only twice.
His 25 yards came primarily from scrambles, including a 15-yard run late in the fourth quarter.
Nick Chubb had five carries for 16 yards, while Woody Marks carried 10 times for only 15 yards.
Houston’s inability to consistently generate rushing yardage made its passing game even more important. Once Seattle created pressure on Stroud, Houston had fewer efficient alternatives.
Jaxon Smith-Njigba Leads Seattle Receivers
Jaxon Smith-Njigba was the standout offensive receiver.
He caught eight passes on 14 targets for 123 yards and one touchdown.
| Statistic | Jaxon Smith-Njigba |
| Targets | 14 |
| Receptions | 8 |
| Receiving Yards | 123 |
| Yards per Reception | 15.4 |
| Touchdowns | 1 |
| Long Reception | 26 |
Smith-Njigba accounted for more than half of Seattle’s receiving yards.
His 14 targets also show how heavily Seattle relied on him as a passing-game focal point.
NFL reporting confirmed the same eight-catch, 123-yard, one-touchdown performance. (NFL)
The touchdown was particularly notable because it came on an 11-yard reception that gave Seattle its 14-0 first-quarter lead. (ESPN)
Houston Receiving Statistics
Dalton Schultz led Houston in receptions and receiving yards.
| Player | Rec | Yards | Avg | TD | Long | Targets |
| Dalton Schultz | 9 | 98 | 10.9 | 0 | 22 | 10 |
| Jaylin Noel | 4 | 77 | 19.3 | 0 | 29 | 7 |
| Nico Collins | 4 | 27 | 6.8 | 0 | 14 | 10 |
| Woody Marks | 3 | 20 | 6.7 | 1 | 9 | 5 |
| Xavier Hutchinson | 1 | 13 | 13.0 | 0 | 13 | 4 |
| Braxton Berrios | 1 | -1 | -1.0 | 0 | -1 | 3 |
| Nick Chubb | 1 | -5 | -5.0 | 0 | -5 | 3 |
| Team | 23 | 229 | 10.0 | 1 | 29 | 46 |
Schultz was Houston’s most consistent receiving outlet by volume.
He caught nine of 10 targets for 98 yards, accounting for a substantial portion of Houston’s passing production.
Jaylin Noel was more explosive on a per-catch basis. His four receptions produced 77 yards, including a 29-yard gain.
Nico Collins, meanwhile, was limited to four receptions for 27 yards on 10 targets.
The distribution is significant because Collins entered the game as one of Houston’s major receiving weapons, but Seattle prevented him from turning his targets into substantial yardage. ESPN’s play-by-play also records that Jones intercepted Stroud on a pass intended for Collins. (ESPN)
Seattle Receiving Statistics Beyond JSN
Seattle’s receiving production was concentrated around Smith-Njigba, but several other players added useful contributions.
| Player | Receptions | Yards | Average | TD | Long | Targets |
| Jaxon Smith-Njigba | 8 | 123 | 15.4 | 1 | 26 | 14 |
| Elijah Arroyo | 4 | 42 | 10.5 | 0 | 27 | 5 |
| Cooper Kupp | 1 | 32 | 32.0 | 0 | 32 | 1 |
| AJ Barner | 1 | 7 | 7.0 | 0 | 7 | 3 |
| Zach Charbonnet | 2 | 6 | 3.0 | 0 | 6 | 2 |
| Jake Bobo | 1 | 3 | 3.0 | 0 | 3 | 1 |
| Tory Horton | 0 | 0 | 0.0 | 0 | 0 | 3 |
| Team | 17 | 213 | 12.5 | 1 | 32 | 29 |
Cooper Kupp had only one reception, but it went for 32 yards.
Elijah Arroyo contributed four receptions for 42 yards, including a 27-yard gain.
That distribution shows that Seattle’s passing game did not require large volume from every receiver. Smith-Njigba handled the majority of the workload, while other players supplied occasional explosive plays.
Defensive Player Statistics
Defense was central to the final result.
Houston recorded 72 tackles, two sacks, eight tackles for loss, five passes defended, and five quarterback hits.
Seattle recorded 65 tackles, three sacks, 10 tackles for loss, 12 passes defended, and seven quarterback hits.
| Defensive Category | Houston | Seattle |
| Total Tackles | 72 | 65 |
| Solo Tackles | 45 | 45 |
| Sacks | 2 | 3 |
| Tackles for Loss | 8 | 10 |
| Passes Defended | 5 | 12 |
| QB Hits | 5 | 7 |
| Defensive TDs | 1 | 0 |
The most striking difference was the number of passes defended.
Seattle recorded 12 compared with Houston’s five.
Seattle also had seven quarterback hits compared with five for Houston.
Those numbers help explain why Houston struggled to sustain efficient passing drives even though Stroud finished with 229 passing yards.
Interceptions and Turnovers
Houston’s defense intercepted Seattle quarterback-related passes twice.
Derek Stingley Jr. recorded one interception and returned it 17 yards.
Calen Bullock also recorded an interception and returned it 11 yards.
Seattle’s Ernest Jones IV recorded one interception and returned it 23 yards.
The turnover totals were ultimately very different.
Houston committed one turnover.
Seattle committed four turnovers, including two interceptions and two lost fumbles.
Yet Houston could not fully capitalize on the turnover advantage.
Seattle’s defense created pressure and repeatedly forced Houston into difficult situations. The Seahawks also produced a critical interception from Jones during the third quarter.
The result is an excellent example of why turnover totals should be studied alongside field position, defensive pressure, scoring efficiency, and red-zone performance rather than viewed in isolation.
Team Statistics That Explain the Result
The team-level statistics provide one of the clearest explanations for the 27-19 result.
| Category | Texans | Seahawks |
| First Downs | 18 | 19 |
| Passing First Downs | 13 | 9 |
| Rushing First Downs | 1 | 6 |
| Total Plays | 69 | 67 |
| Total Yards | 254 | 316 |
| Yards per Play | 3.7 | 4.7 |
| Passing Yards | 198 | 198 |
| Rushing Yards | 56 | 118 |
| Rushing Attempts | 17 | 33 |
| Yards per Rush | 3.3 | 3.6 |
| Third Down | 2/15 | 2/14 |
| Fourth Down | 1/4 | 2/2 |
| Red Zone | 1/3 | 3/4 |
| Turnovers | 1 | 4 |
| Possession | 27:43 | 32:17 |
One of the most revealing statistics is total yardage.
Seattle gained 316 yards despite having slightly fewer offensive plays than Houston.
That produced 4.7 yards per play for Seattle compared with 3.7 for Houston.
The rushing difference was also substantial. Seattle gained 118 yards on the ground, while Houston produced only 56.
Seattle’s red-zone performance was another important difference. The Seahawks scored on three of four red-zone opportunities, while Houston scored on one of three.
The Texans did convert both of their fourth-down attempts, while Seattle went 2-for-2. However, Houston’s third-down conversion rate was only 2-for-15.
These numbers demonstrate how a team can possess the ball for 32 minutes and still struggle to turn that possession into points.
Special Teams Player Stats
Special teams also played a role in the field-position battle.
Kick Returns
Tremon Smith was Houston’s primary kick returner, recording six returns for 154 yards and averaging 25.7 yards per return. His longest return went 33 yards.
Seattle’s George Holani returned three kicks for 88 yards, averaging 29.3 yards per return with a 34-yard long return.
Dareke Young added one return for 28 yards.
Punt Returns
Braxton Berrios returned three Houston punts for 25 yards.
Tory Horton returned five punts for Seattle for 67 yards, averaging 13.4 yards per return.
Kicking
Ka’imi Fairbairn converted both of his field-goal attempts and added one extra point for seven points.
Jason Myers converted two of three field goals and all three extra points for nine points.
Myers’ longest successful field goal was 47 yards, while Fairbairn’s longest was 46 yards.
Punting
Tommy Townsend punted seven times for 344 yards, averaging 49.1 yards per punt.
Michael Dickson punted four times for 205 yards, averaging 51.3 yards.
Seattle’s punt return production and Dickson’s average helped the Seahawks compete effectively in field position despite Houston’s high punt volume.
What the Stats Say About Seattle’s Offense
The offensive story for Seattle can be reduced to three themes: balanced rushing, concentrated receiving production, and red-zone execution.
Seattle ran 33 times and passed 32 times.
That balance kept the offense from becoming one-dimensional.
The Seahawks also scored both rushing touchdowns through Charbonnet, while Smith-Njigba supplied the passing touchdown.
Seattle’s 118 rushing yards were particularly useful because the team did not need Darnold to produce a huge passing total.
Darnold’s 213 passing yards were enough because Seattle consistently generated better efficiency on a per-play basis.
What the Stats Say About Houston’s Offense
Houston’s biggest statistical challenge was offensive efficiency.
The Texans produced 254 total yards from 69 plays.
That equates to 3.7 yards per play.
Stroud attempted 49 passes, but Houston’s passing attack averaged only 3.8 yards per pass according to the team statistics.
Houston also managed only 56 rushing yards.
The result was an offense that generated a lot of activity without consistently generating high-value plays.
Dalton Schultz and Jaylin Noel provided useful receiving production, but Houston needed more efficiency from its overall passing game.
The fourth-quarter touchdown showed that the Texans could move the football when operating quickly, but by then Seattle had already established a substantial advantage.
Why Jaxon Smith-Njigba’s Numbers Matter
The seahawks vs texans match player stats are difficult to discuss without focusing on Smith-Njigba.
His eight catches for 123 yards represented more than half of Seattle’s receiving yardage.
The 14 targets were also more than any other Seattle receiver received.
That target concentration tells us how Seattle’s passing offense was structured in this matchup.
Houston knew Smith-Njigba was a primary threat, but he still produced multiple meaningful gains.
NFL coverage described his performance as another 100-yard game and noted that Houston had specifically prepared to limit him. (NFL)
That makes his production more meaningful than the raw yardage figure alone.
Why Ernest Jones IV’s Performance Matters
Jones’ interception was one of the game’s pivotal defensive moments.
He read a pass intended for Collins, stepped in front of the throw, and returned the interception deep enough to provide Seattle with an opportunity to add points.
He also produced a high tackle total.
The broader lesson is that Seattle’s defense was effective at multiple levels.
The defensive line created pressure.
The linebackers contributed to coverage and tackling.
The secondary generated pass breakups and an interception.
That combination limited Houston’s ability to convert possessions into touchdowns.
The Biggest Statistical Differences
Several numbers separate the two teams.
Seattle’s Rushing Advantage
Seattle gained 118 rushing yards compared with Houston’s 56.
That is a 62-yard difference.
The Seahawks also scored two rushing touchdowns, while Houston scored none on the ground.
Seattle’s Efficiency
Seattle averaged 4.7 yards per play.
Houston averaged 3.7.
That one-yard-per-play difference became significant across 67 to 69 offensive snaps.
Red-Zone Execution
Seattle went 3-for-4 in the red zone.
Houston went 1-for-3.
That difference translated directly into points.
Defensive Pressure
Seattle recorded three sacks and seven quarterback hits.
Houston recorded two sacks and five quarterback hits.
The NFL reported that Seattle pressured Stroud on 31.5% of his dropbacks. (NFL)
Passing Production
Both teams officially recorded 198 net passing yards in the team statistics.
The difference was how those yards were generated.
Seattle paired its passing game with a stronger rushing attack and better red-zone conversion.
Houston had 49 quarterback attempts but struggled to turn those attempts into efficient production.
A Closer Look at the Turnover Paradox
One of the most interesting aspects of this game is that Seattle won despite committing more turnovers.
The Seahawks had four turnovers compared with one for Houston.
Seattle lost two fumbles and threw two interceptions.
Houston threw one interception and lost no fumbles.
Normally, that creates a significant disadvantage.
Yet Seattle still won by eight points.
The explanation lies in the rest of the statistical profile.
Seattle gained 62 more rushing yards.
The Seahawks averaged one full yard more per offensive play.
Seattle converted all four of its red-zone opportunities except one.
Houston failed on two of its three red-zone trips.
Seattle’s defense also generated more quarterback pressure and more passes defended.
This is why a complete game analysis should never rely on one statistical category.
Player Stats Table: Key Contributors
| Team | Player | Key Production |
| Seattle | Sam Darnold | 17/31, 213 yards, 1 TD, 1 INT |
| Seattle | Kenneth Walker III | 17 carries, 66 yards |
| Seattle | Zach Charbonnet | 12 carries, 49 yards, 2 TD |
| Seattle | Jaxon Smith-Njigba | 8 receptions, 123 yards, 1 TD |
| Seattle | Elijah Arroyo | 4 receptions, 42 yards |
| Seattle | Ernest Jones IV | Interception, high tackle production |
| Houston | C.J. Stroud | 23/49, 229 yards, 1 TD, 1 INT |
| Houston | Nick Chubb | 5 carries, 16 yards |
| Houston | Woody Marks | 10 carries, 15 yards, 1 receiving TD |
| Houston | Dalton Schultz | 9 receptions, 98 yards |
| Houston | Jaylin Noel | 4 receptions, 77 yards |
| Houston | Nico Collins | 4 receptions, 27 yards |
The Role of Field Position
Field position is often missing from simple player-stat summaries, but it helps explain this matchup.
Seattle’s defense repeatedly forced Houston into difficult situations.
Nwosu’s 18-yard sack in the first quarter pushed Houston into a severe field-position disadvantage and helped Seattle gain an early scoring opportunity. (ESPN)
Seattle’s return game also provided useful starting positions.
Tory Horton’s 67 punt-return yards were especially valuable because they reduced the distance Seattle’s offense needed to travel after Houston punts.
The Seahawks did not need to dominate every offensive category because their defense and special teams repeatedly created favorable circumstances.
Important Context for Fantasy Football Analysis
For fantasy football readers, individual box-score interpretation requires some caution.
Smith-Njigba’s 123 receiving yards and touchdown make him the obvious standout fantasy contributor from Seattle’s receiving group in this particular game.
Charbonnet’s two rushing touchdowns were highly valuable, even though he had fewer rushing yards than Walker.
Walker led Seattle in carries and rushing yards, showing why volume and touchdowns should be evaluated separately.
For Houston, Schultz’s nine receptions and 98 yards demonstrate strong volume, while Noel’s 77 yards on four catches highlight his big-play efficiency.
Stroud’s 229 passing yards and one touchdown were offset by his interception and the low passing efficiency.
These are game-specific observations rather than recommendations for future fantasy lineups.
Historical and Official Game Context
The game was played on Monday, October 20, 2025, at Lumen Field in Seattle.
The official NFL schedule lists the result as Texans 19, Seahawks 27 in Week 7, with Seattle entering its Week 8 bye afterward. (NFL)
ESPN’s game record identifies the matchup with Game ID 401772826. (ESPN)
For readers who want to verify the complete box score, play-by-play information, scoring sequence, and official statistical categories, the ESPN game box score provides the detailed record.
Common Mistakes When Reading These Player Stats
Looking Only at Passing Yards
Stroud threw for 229 yards, while Darnold threw for 213.
A quick glance could suggest Houston’s passing offense performed slightly better.
The broader numbers tell a different story.
Seattle averaged 6.9 yards per attempt through Darnold’s individual passing line compared with 4.7 for Stroud.
Ignoring Rushing Production
Seattle’s 118 rushing yards were a major part of the victory.
Houston produced only 56.
That 62-yard difference reduced pressure on Darnold and made it easier for Seattle to protect its lead.
Ignoring Red-Zone Results
Seattle converted three of four red-zone opportunities.
Houston converted only one of three.
That difference matters because red-zone possessions have a direct relationship with scoring efficiency.
Treating Turnovers as the Entire Story
Seattle turned the ball over four times but still won.
That does not make turnovers unimportant.
It shows that turnovers are one part of a much larger statistical picture.
Confusing Individual and Team Passing Lines
Darnold finished 17-for-31 with one interception.
Kupp attempted one pass and threw another interception.
Therefore, Seattle’s team passing line became 17-for-32 with two interceptions.
Readers comparing quarterback statistics with team statistics should account for trick-play attempts and non-quarterback passes.
Frequently Asked Questions
What was the final score of the Seahawks vs Texans game?
Seattle defeated Houston 27-19 on October 20, 2025. Seattle scored 14 points in the first quarter and 13 in the third quarter. (ESPN)
How many yards did C.J. Stroud pass for?
C.J. Stroud completed 23 of 49 passes for 229 yards, one touchdown, and one interception. He was sacked three times for 31 yards. (ESPN)
How many yards did Sam Darnold have?
Sam Darnold completed 17 of 31 passes for 213 yards, one touchdown, and one interception. He was sacked twice for 15 yards. (ESPN)
Who led the Seahawks in receiving?
Jaxon Smith-Njigba led Seattle with eight receptions for 123 yards and one touchdown on 14 targets. (NFL)
Who scored Seattle’s rushing touchdowns?
Zach Charbonnet scored both of Seattle’s rushing touchdowns. He finished with 12 carries for 49 yards and two touchdowns.
Who led Houston in receiving?
Dalton Schultz led Houston with nine receptions for 98 yards on 10 targets. Jaylin Noel followed with four catches for 77 yards.
Conclusion
The seahawks vs texans match player stats show a game in which Seattle’s overall efficiency outweighed its turnover problems.
The Seahawks gained 316 total yards compared with Houston’s 254 and produced 118 rushing yards compared with the Texans’ 56. Seattle also averaged 4.7 yards per play, compared with 3.7 for Houston.
Jaxon Smith-Njigba was Seattle’s leading receiving weapon with 123 yards and a touchdown. Kenneth Walker III supplied the highest rushing workload, while Zach Charbonnet turned his 12 carries into 49 yards and two touchdowns.
For Houston, C.J. Stroud finished with 229 passing yards, one touchdown, and one interception. Dalton Schultz led the receiving group with 98 yards, while Jaylin Noel added 77 yards on only four receptions.
Defensively, Seattle generated three sacks, seven quarterback hits, 10 tackles for loss, and 12 passes defended. Ernest Jones IV also produced a critical interception.
The final 27-19 score therefore reflects more than a simple difference in points. Seattle’s rushing efficiency, red-zone execution, defensive pressure, and ability to create separation early helped offset four turnovers and allowed the Seahawks to close out the victory.