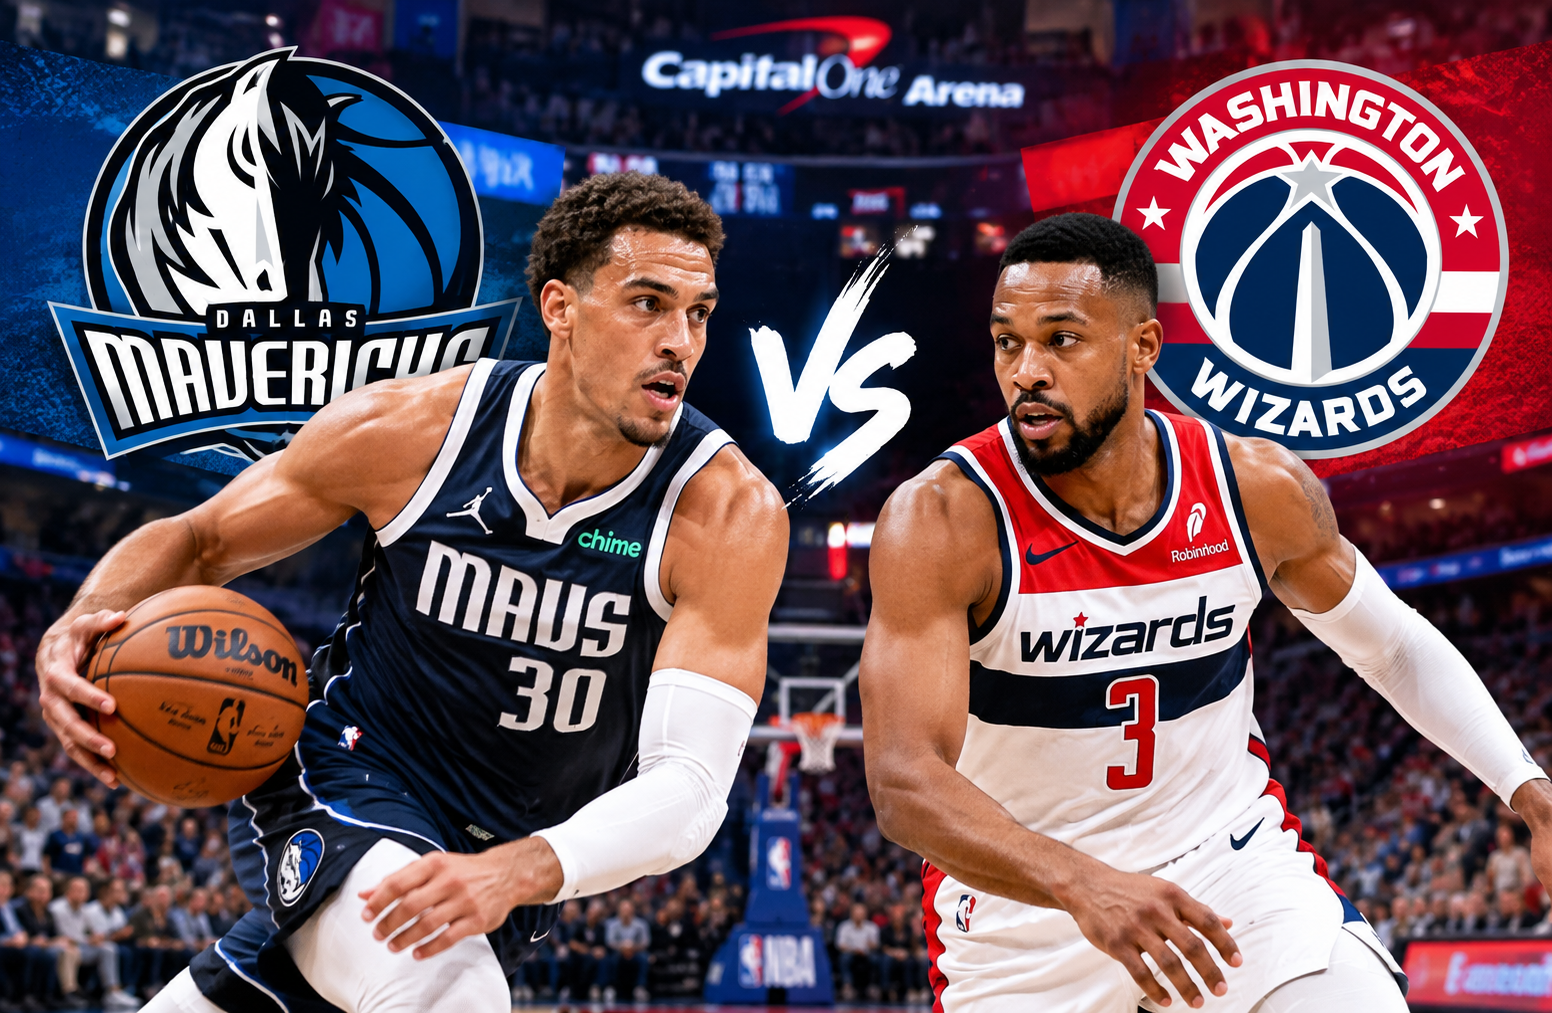
washington wizards vs dallas mavericks match player stats
The washington wizards vs dallas mavericks match player stats from the November 9, 2025 game tell a much more detailed story than the final score alone. Dallas defeated Washington 111-105 at Capital One Arena, but the game was highly competitive after the Mavericks built an early advantage. Washington actually led 86-82 after three quarters before Dallas responded with a 29-19 fourth quarter. Dwight Powell led Dallas with 30 points, while C.J. McCollum paced Washington with 25. The official NBA game record lists an attendance of 16,258 and confirms the 111-105 final score.
For readers looking beyond the headline result, this matchup provides several useful statistical angles. Dallas won the rebounding battle 51-44, generated 26 assists compared with Washington’s 17, and recorded 15 steals. Washington shot 87% from the free throw line and made more three-pointers, but 18 turnovers limited the value of that shooting efficiency.
Game Overview
The Mavericks entered the contest with a 3-7 record and a 1-3 road record, while the Wizards were 1-9 and 0-5 at home. The result moved the season series to 1-1 after Washington had won the earlier meeting 117-107 in Dallas. ESPN’s record for that first matchup identifies it as October 24, 2025.
The second meeting was particularly interesting because the two teams produced very different statistical profiles.
Dallas:
- Final score: 111
- Field goals: 42-of-93
- Three-pointers: 6-of-24
- Free throws: 21-of-30
- Rebounds: 51
- Assists: 26
- Turnovers: 13
- Steals: 15
- Blocks: 6
Washington:
- Final score: 105
- Field goals: 37-of-89
- Three-pointers: 11-of-35
- Free throws: 20-of-23
- Rebounds: 44
- Assists: 17
- Turnovers: 18
- Steals: 7
- Blocks: 7
The numbers show that Dallas did not win because it was dramatically better from three-point range. In fact, the Mavericks shot only 25% from deep. Instead, their advantage came through overall shot volume, rebounding, ball movement, transition production and their ability to create turnovers.
Washington Wizards vs Dallas Mavericks Match Player Stats
The individual numbers provide an even clearer explanation of how the game developed.
Dallas Mavericks Player Statistics
| Player | MIN | PTS | FG | 3PT | FT | REB | AST | STL | BLK | TO | +/- |
| Dwight Powell | 31 | 30 | 9-14 | 3-4 | 9-11 | 8 | 2 | 3 | 0 | 0 | +6 |
| P.J. Washington | 37 | 14 | 4-8 | 0-2 | 6-6 | 9 | 5 | 1 | 1 | 2 | +13 |
| Naji Marshall | 31 | 14 | 6-16 | 1-4 | 1-2 | 9 | 6 | 4 | 0 | 1 | +24 |
| Cooper Flagg | 34 | 12 | 6-15 | 0-2 | 0-0 | 7 | 6 | 2 | 0 | 4 | -2 |
| Max Christie | 31 | 12 | 4-14 | 1-5 | 3-3 | 7 | 2 | 3 | 0 | 0 | +10 |
| Daniel Gafford | 19 | 8 | 4-5 | 0-0 | 0-0 | 5 | 0 | 0 | 2 | 2 | -2 |
| Brandon Williams | 26 | 14 | 6-16 | 1-4 | 1-2 | 2 | 6 | 4 | 0 | 1 | +24 |
| Jaden Hardy | 14 | 8 | 3-5 | 1-1 | 1-2 | 1 | 0 | 0 | 0 | 1 | +5 |
| Moussa Cisse | 19 | 5 | 2-3 | 0-0 | 1-4 | 9 | 1 | 0 | 3 | 2 | +2 |
| Ryan Nembhard | 8 | 0 | 0-1 | 0-0 | 0-0 | 0 | 2 | 0 | 0 | 1 | -7 |
| D’Angelo Russell | 17 | 6 | 3-10 | 0-6 | 0-2 | 2 | 1 | 0 | 0 | 0 | -18 |
Dallas’ team totals are consistent with the official box score: 42-of-93 shooting, 6-of-24 from three, 21-of-30 at the line, 51 rebounds, 26 assists, 13 turnovers and 15 steals.
Washington Wizards Player Statistics
| Player | MIN | PTS | FG | 3PT | FT | REB | AST | STL | BLK | TO | +/- |
| C.J. McCollum | 33 | 25 | 9-19 | 2-6 | 5-6 | 6 | 2 | 2 | 2 | 3 | -11 |
| Cam Whitmore | 29 | 19 | 7-13 | 3-6 | 2-2 | 3 | 0 | 0 | 0 | 0 | -9 |
| Alex Sarr | 31 | 17 | 6-16 | 0-3 | 5-6 | 6 | 5 | 2 | 3 | 2 | +1 |
| Marvin Bagley III | 17 | 10 | 4-7 | 0-0 | 2-2 | 5 | 1 | 0 | 1 | 2 | -7 |
| Kyshawn George | 29 | 10 | 3-9 | 2-6 | 2-2 | 2 | 3 | 1 | 0 | 2 | -1 |
| Tre Johnson | 26 | 9 | 4-13 | 1-6 | 0-0 | 9 | 0 | 1 | 0 | 3 | +1 |
| Bub Carrington | 28 | 9 | 2-7 | 2-5 | 3-3 | 3 | 2 | 0 | 0 | 5 | -14 |
| Corey Kispert | 24 | 4 | 1-3 | 1-2 | 1-2 | 1 | 2 | 0 | 1 | 0 | -4 |
| Malaki Branham | 10 | 2 | 1-2 | 0-1 | 0-0 | 4 | 2 | 0 | 0 | 1 | 0 |
| Jamir Watkins | 1 | 0 | 0-0 | 0-0 | 0-0 | 0 | 0 | 0 | 0 | 0 | +3 |
Washington finished 37-of-89 from the field, 11-of-35 from three and 20-of-23 from the free throw line. The Wizards also collected seven blocks, but their 18 turnovers were a major difference in the overall possession battle.
Dwight Powell’s 30-Point Performance
Dwight Powell was the most productive scorer in the game.
He finished with 30 points on 9-of-14 shooting from the field, 3-of-4 from three-point range and 9-of-11 from the free throw line. He also collected eight rebounds and three steals without committing a turnover. His 31 minutes produced one of the most efficient offensive performances in the game.
The efficiency matters as much as the scoring total.
Powell did not need a huge number of attempts to reach 30 points. He converted 64.3% of his field goal attempts and 75% of his three-point attempts. His free throw shooting added another nine points.
That combination made his 30-point performance especially valuable because Dallas received efficient scoring rather than simply high-volume scoring.
Powell’s eight rebounds also helped Dallas maintain its overall 51-44 advantage on the glass.
C.J. McCollum Leads Washington’s Offense
C.J. McCollum was Washington’s leading scorer with 25 points.
He shot 9-of-19 from the field, 2-of-6 from three and 5-of-6 from the free throw line. He added six rebounds, two assists, two steals and two blocks. However, he also committed three turnovers and finished with a -11 plus-minus.
One important detail is that McCollum’s scoring production was not evenly distributed across the game.
The NBA’s game summary notes that he scored 25 points but had only two points after halftime. That distinction is important when analyzing the final result. A player can produce an excellent overall scoring line while having a smaller impact during the possessions that decide the fourth quarter.
For Washington, the problem was not a lack of scoring options. The Wizards had three players reach at least 17 points, but the offense did not maintain the same effectiveness late in the game.
Cam Whitmore Provides a Major Scoring Burst
Cam Whitmore scored 19 points on 7-of-13 shooting and made three of his six three-point attempts.
His performance became particularly important during Washington’s third-quarter comeback. The official NBA summary reports that Whitmore scored 11 points in the third quarter as the Wizards moved in front. Washington entered the final period leading 86-82.
That third-quarter production shows why a basic final-score analysis can miss the most interesting part of the game.
Washington did not simply stay close throughout the night. The Wizards recovered from a first-quarter deficit, took control during the third quarter and entered the fourth quarter with a four-point advantage.
The decisive change came afterward.
Alex Sarr’s All-Around Contribution
Alex Sarr finished with 17 points, six rebounds, five assists, two steals and three blocks.
His 17 points came on 6-of-16 shooting, while he converted five of six free throws. Although he did not make a three-pointer, his overall defensive contribution was substantial.
Sarr’s three blocks tied the Dallas team leader for the highest individual block total in the game. He also recorded five assists, making him one of Washington’s more important connective players.
His +1 plus-minus is also notable because Washington lost the game by six points. It suggests that his individual minutes were not representative of the overall team result.
This is one reason analysts should avoid treating plus-minus as a standalone measure of individual performance.
Naji Marshall’s Two-Way Impact
Naji Marshall had one of the most complete statistical games for Dallas.
He recorded:
- 14 points
- 9 rebounds
- 6 assists
- 4 steals
- 1 three-pointer
- 1 turnover
- 0 blocks
More importantly, he finished with a +24 plus-minus. That was one of Dallas’ strongest plus-minus marks in the game.
Marshall’s four steals were tied for the Dallas team lead with Brandon Williams. His six assists also tied him with Cooper Flagg and Brandon Williams among Dallas players with significant offensive creation responsibilities.
This type of contribution is easy to overlook when focusing only on points.
Marshall was involved in scoring creation, rebounding, defensive disruption and ball movement. His statistical profile helps explain why Dallas could win despite shooting only 25% from three.
P.J. Washington’s Balanced Box Score
P.J. Washington finished with 14 points, nine rebounds, five assists, one steal and one block.
He shot 4-of-8 from the field and made all six of his free throw attempts. His +13 plus-minus was another important indicator of his overall influence.
Washington’s contribution was not based on high scoring volume.
Instead, he supplied several smaller advantages:
- Efficient shooting
- Defensive activity
- Rebounding
- Playmaking
- Reliable free throw shooting
His five assists were particularly useful because Dallas finished with 26 assists as a team.
Cooper Flagg’s Statistical Profile
Cooper Flagg recorded 12 points, seven rebounds, six assists and two steals.
He shot 6-of-15 from the field but missed both of his three-point attempts. He also committed four turnovers, which was the highest total among Dallas players.
The interesting part of his performance was the distribution of his contributions.
Flagg did not have a dominant scoring night, but six assists and seven rebounds gave him value in other areas.
His -2 plus-minus also shows why individual plus-minus should be interpreted within the broader context of the game. Dallas won, but Flagg’s individual minutes were slightly negative by that measure.
For a young player handling a broad role, the box score suggests that his impact was not limited to scoring.
The Fourth Quarter Decided the Game
The clearest statistical turning point was the final period.
Dallas outscored Washington 29-19 in the fourth quarter.
That 10-point difference erased Washington’s four-point lead entering the period and produced the six-point final margin.
The quarter-by-quarter sequence was:
| Quarter | Dallas | Washington | Margin |
| 1st | 35 | 24 | Dallas +11 |
| 2nd | 22 | 29 | Washington +7 |
| 3rd | 25 | 33 | Washington +8 |
| 4th | 29 | 19 | Dallas +10 |
| Final | 111 | 105 | Dallas +6 |
The game therefore cannot be accurately described as a wire-to-wire Dallas victory.
Dallas dominated the opening quarter, Washington responded strongly in the second and third, and Dallas produced the decisive response in the fourth. The NBA’s official game summary confirms that Washington held an 86-82 advantage entering the final period.
Shooting Efficiency vs Shot Volume
One of the most useful lessons from this matchup is the difference between shooting percentage and total offensive production.
Dallas:
- 42-of-93 from the field
- 45% field goal percentage
- 6-of-24 from three
- 25% three-point percentage
- 21-of-30 free throws
Washington:
- 37-of-89 from the field
- 42% field goal percentage
- 11-of-35 from three
- 31% three-point percentage
- 20-of-23 free throws
Washington was more accurate from three and much better from the free throw line.
Yet Dallas scored six more points.
Why?
The Mavericks attempted four more field goals, made five more total field goals and converted one more free throw. Dallas also generated more possessions through its 15 steals and protected the ball better.
The lesson is simple: a higher three-point percentage does not automatically produce a higher final score.
Turnovers Were a Major Difference
Dallas committed 13 turnovers.
Washington committed 18.
That five-turnover difference matters because turnovers do not simply remove an offensive opportunity. They can also create scoring opportunities for the opponent.
Dallas recorded 15 steals compared with Washington’s seven. The Mavericks therefore combined better ball security with significantly more defensive disruption.
The possession battle helps explain why Dallas could overcome its poor three-point shooting.
Washington’s 18 turnovers represented a significant amount of lost offensive opportunity. Meanwhile, Dallas’ 13 turnovers were relatively manageable considering the pace and physicality of the game.
Rebounding Gave Dallas Extra Control
Dallas won the rebounding battle 51-44.
The seven-rebound advantage was spread across several players rather than relying on one dominant interior performance.
Naji Marshall and P.J. Washington each grabbed nine rebounds. Cooper Flagg had seven, Max Christie had seven and Daniel Gafford had five. Dwight Powell added eight.
Washington’s leading rebounder was Tre Johnson with nine, while McCollum and Sarr each had six.
The difference was therefore collective.
Dallas had multiple players contributing to the glass, which helped compensate for its inconsistent perimeter shooting.
Dallas Won the Assist Battle
Dallas recorded 26 assists.
Washington had 17.
That nine-assist difference is one of the clearest indicators of the different offensive approaches in the game.
Dallas received six assists each from Naji Marshall and Cooper Flagg, while P.J. Washington added five. Brandon Williams also produced six assists.
Washington’s best passing numbers came from Alex Sarr with five assists and Kyshawn George with three.
The difference does not mean every Dallas basket was created by an assist, but it does demonstrate that Dallas generated more shared offensive creation.
The Importance of Steals and Transition Opportunities
Dallas finished with 15 steals compared with Washington’s seven.
The NBA game summary also shows Dallas scoring 33 fast-break points compared with 13 for Washington.
That is a 20-point advantage in transition scoring.
This statistic is particularly useful when explaining the game because it connects several other numbers.
Dallas:
- Created more steals.
- Generated more transition opportunities.
- Scored more fast-break points.
- Attempted more field goals.
- Finished with more total points.
The chain is more informative than looking at any single category in isolation.
Washington’s Free Throw Shooting Was Excellent
Washington converted 20 of 23 free throws.
That equals 87%.
Dallas made 21 of 30, or 70%.
This was one of Washington’s strongest statistical advantages.
The Wizards therefore left relatively few points at the free throw line. McCollum went 5-of-6, Sarr went 5-of-6, Whitmore went 2-of-2, Bagley went 2-of-2 and George went 2-of-2.
Despite that efficiency, Washington could not compensate for the turnover and transition disadvantages.
This is another reminder that basketball results are usually produced by several interacting statistical categories rather than one headline metric.
What the Plus-Minus Numbers Tell Us
Plus-minus can be useful, but it should not be treated as a complete player rating.
For Dallas, Naji Marshall and Brandon Williams each finished at +24. P.J. Washington was +13 and Max Christie was +10.
For Washington, several players had positive numbers despite the loss. Alex Sarr finished +1, Tre Johnson +1, Malaki Branham 0 and Jamir Watkins +3.
This illustrates an important point.
A player can have a positive plus-minus in a losing game because his team performed well during his minutes. Likewise, a player on the winning team can have a negative plus-minus.
For serious player analysis, plus-minus should therefore be read alongside scoring, efficiency, rebounds, assists, turnovers and defensive statistics.
A Closer Look at Dallas’ Offensive Formula
Dallas’ offense was effective without being particularly efficient from three.
The Mavericks scored 66 points in the paint, compared with 44 for Washington. They also scored 33 fast-break points.
That combination explains much of the offensive result.
Dallas did not depend on perimeter shooting to generate its offense. Instead, it created value through:
- Interior scoring
- Transition opportunities
- Offensive rebounding
- Ball movement
- Free throws
- Turnovers forced
The six made three-pointers were helpful, but they were not the central reason Dallas reached 111 points.
A Closer Look at Washington’s Offensive Formula
Washington’s offense had several strengths.
The Wizards made 11 three-pointers, shot 87% from the free throw line and received 25 points from McCollum, 19 from Whitmore and 17 from Sarr.
However, the offense produced only 17 assists while committing 18 turnovers.
That ratio is particularly important.
Washington created many successful individual scoring possessions, but the team did not generate the same level of assisted offense as Dallas.
The Wizards also scored only 13 fast-break points compared with Dallas’ 33.
Why the Game Was Close Despite Dallas’ Early Lead
Dallas opened the game with a 35-24 first quarter.
That 11-point advantage looked significant.
Washington then responded with a 29-22 second quarter and followed it with a 33-25 third quarter. Over those two periods, Washington outscored Dallas 62-47.
The Wizards therefore transformed an 11-point first-quarter deficit into an 86-82 lead.
That turnaround is one of the most important pieces of context for anyone studying the game.
Dallas did not simply control the entire contest. Washington’s third-quarter surge was strong enough to completely reverse the momentum.
The final quarter was where Dallas recovered control.
Season Series Context
The November matchup was the second meeting between these teams during the 2025-26 season.
Washington won the first meeting 117-107 in Dallas. ESPN’s box score records that result on October 24, 2025.
Dallas then responded with a 111-105 victory in Washington.
That left the season series tied at 1-1 based on the two games provided in the matchup data.
The contrast between the two results is interesting because Washington’s first victory came despite Dallas scoring 107 points, while the second meeting saw Dallas score 111 and Washington score 105.
The two teams therefore exchanged victories while producing different statistical paths to those results.
What These Player Stats Reveal
The most useful takeaway from the washington wizards vs dallas mavericks match player stats is that the final score was produced by a combination of possession control, transition scoring and fourth-quarter execution.
Dallas did not dominate every statistical category.
Washington had:
- Better three-point percentage
- More made three-pointers
- Better free throw percentage
- More blocks
Dallas had:
- More total rebounds
- More assists
- Fewer turnovers
- More steals
- More fast-break points
- More points in the paint
That balance makes the game a useful example of why box-score analysis should go deeper than scoring totals.
Key Player Takeaways
Dwight Powell
Powell’s 30 points were the biggest individual scoring contribution of the game. His 9-of-14 shooting, 8 rebounds, three steals and zero turnovers made the performance especially efficient.
C.J. McCollum
McCollum scored 25 points and led Washington’s scoring, but his production dropped sharply after halftime. His first-half scoring created an important foundation, while Washington needed more late-game creation.
Naji Marshall
Marshall’s 14 points do not fully represent his influence. Nine rebounds, six assists, four steals and a +24 plus-minus made his contribution considerably broader.
P.J. Washington
P.J. Washington combined 14 points with nine rebounds and five assists. His perfect 6-of-6 free throw shooting also helped Dallas convert scoring opportunities.
Alex Sarr
Sarr produced 17 points, six rebounds, five assists and three blocks. His all-around production was one of the more complete individual performances for Washington.
Cam Whitmore
Whitmore’s 19 points included 11 in the third quarter, helping Washington move from a deficit into an 86-82 lead heading into the fourth.
Cooper Flagg
Flagg contributed 12 points, seven rebounds and six assists. His four turnovers were a negative, but his six assists demonstrate the breadth of his role.
Frequently Asked Questions
Who was the top scorer in the Mavericks vs Wizards game?
Dwight Powell led Dallas with 30 points. C.J. McCollum was Washington’s leading scorer with 25 points.
What was the final score between Dallas and Washington?
The Dallas Mavericks defeated the Washington Wizards 111-105.
How many points did C.J. McCollum score?
C.J. McCollum scored 25 points on 9-of-19 shooting from the field. He also made two three-pointers and five free throws.
How many points did Dwight Powell score?
Dwight Powell scored 30 points on 9-of-14 field goal shooting. He also made three of four three-point attempts and nine of 11 free throws.
Who led the game in rebounds?
Naji Marshall and P.J. Washington each recorded nine rebounds for Dallas, while Tre Johnson led Washington with nine rebounds.
Why did Dallas win despite shooting only 25% from three?
Dallas compensated for its poor three-point shooting through a 51-44 rebounding advantage, 26-17 assist advantage, 15 steals, fewer turnovers and a major 33-13 advantage in fast-break points.
Conclusion
The washington wizards vs dallas mavericks match player stats show a game decided by much more than the six-point final margin.
Dwight Powell’s 30 points gave Dallas the headline individual performance, while Naji Marshall, P.J. Washington, Cooper Flagg and Brandon Williams provided important contributions across multiple statistical categories. For Washington, C.J. McCollum led the scoring with 25, while Cam Whitmore’s third-quarter burst and Alex Sarr’s all-around performance helped the Wizards take an 86-82 lead into the final period.
The defining statistical differences were Dallas’ 51-44 rebounding advantage, 26-17 assist edge, 15-7 steal advantage, 13-18 turnover margin and 33-13 advantage in fast-break points. Washington’s superior three-point and free throw percentages were not enough to overcome those possession and transition differences.
The game ultimately demonstrates why a complete NBA box-score analysis should examine scoring efficiency, possession control, rebounding, playmaking, turnovers, defensive events and quarter-by-quarter performance together.