Denver Broncos vs Texans Match Player Stats
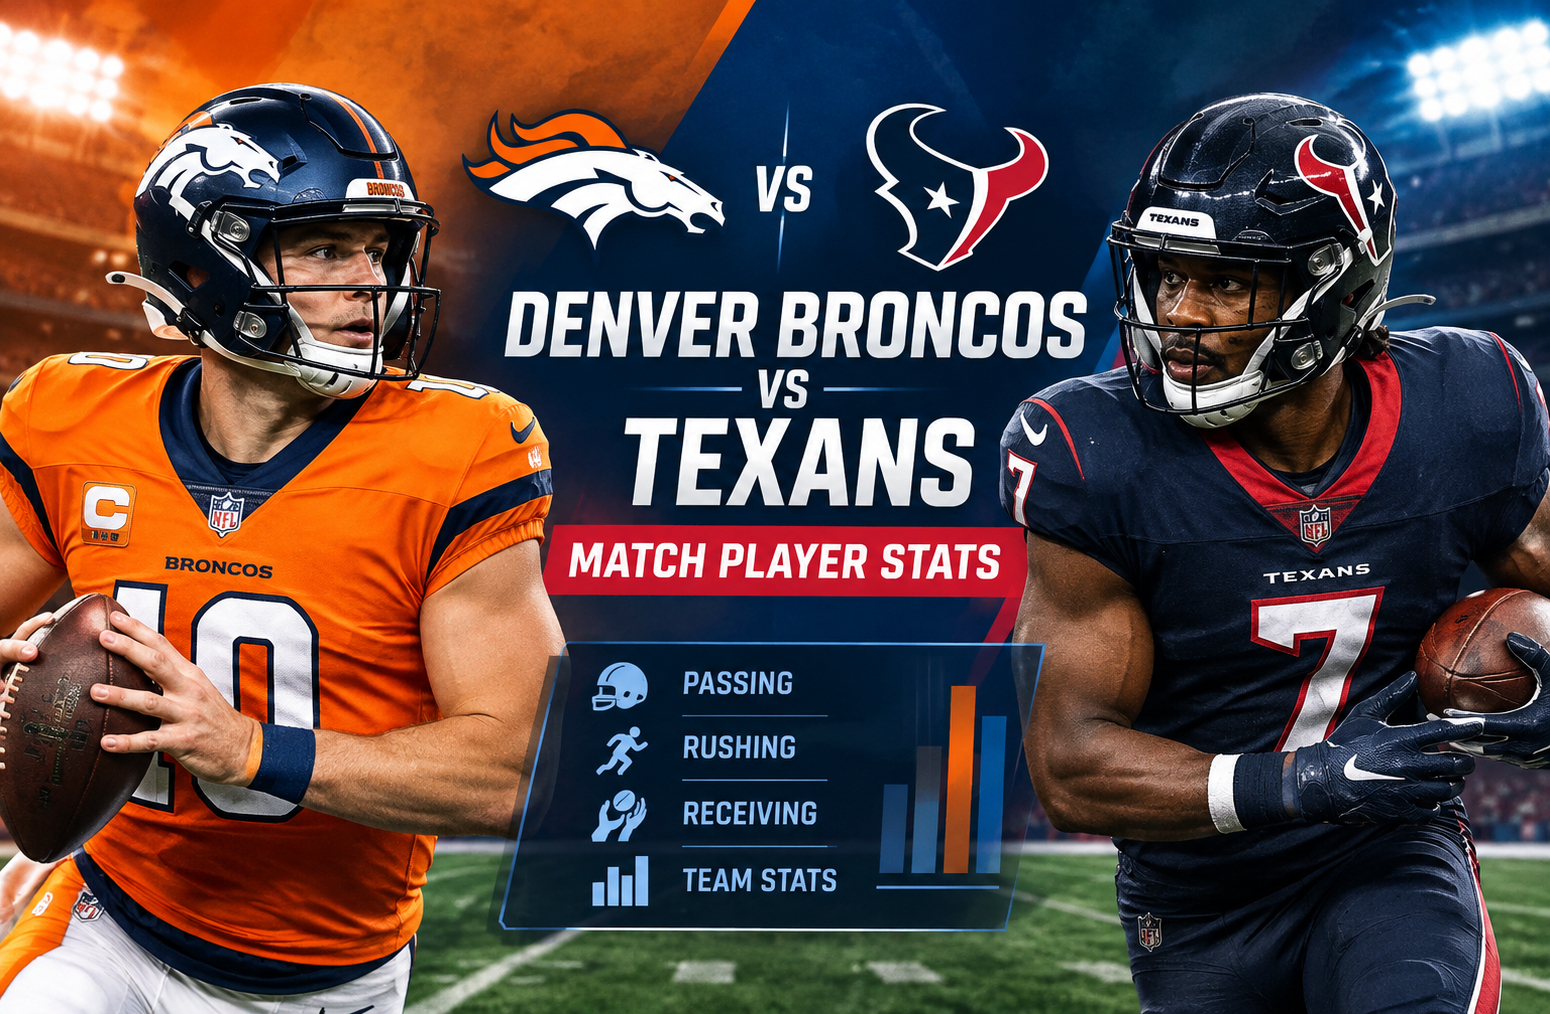
The Denver Broncos vs Texans match player stats from November 2, 2025 tell the story of a close game that changed dramatically after halftime. Denver defeated Houston 18-15 after trailing 15-7 entering the fourth quarter. Bo Nix threw two touchdown passes, J.K. Dobbins led Denver on the ground, RJ Harvey produced a touchdown reception, and Wil Lutz kicked the game-winning 34-yard field goal as time expired. Houston moved the ball through its receiving group but struggled to sustain drives late in the game.
The game was particularly interesting from a statistical perspective because neither offense produced a huge yardage total. Denver finished with 271 total yards, while Houston had 268. The difference came from efficiency in key situations, turnovers, rushing efficiency, defensive pressure, and Denver’s ability to produce 11 fourth-quarter points.
Denver Broncos vs Texans Match Player Stats: Game Overview
The matchup took place on November 2, 2025, at Houston. Denver entered the game with a 6-2 record and improved to 7-2 after the victory, while Houston dropped to 3-5. The Broncos also improved to 3-2 on the road.
The final score was:
| Team | Q1 | Q2 | Q3 | Q4 | Final |
| Denver Broncos | 0 | 7 | 0 | 11 | 18 |
| Houston Texans | 3 | 9 | 3 | 0 | 15 |
Houston controlled the scoreboard for most of the afternoon. The Texans led 3-0 after the first quarter, 12-7 at halftime, and 15-7 after three quarters.
Denver’s fourth-quarter response changed everything.
The Broncos scored a touchdown with 12:28 remaining, converting the two-point attempt to tie the game at 15-15. With no time left on the clock, Lutz converted a 34-yard field goal to give Denver the victory.
For readers who want to compare the complete official box score, the game box score provides the full statistical record.
Denver Broncos Offensive Player Stats
Denver’s offense was not dominant in traditional yardage terms. The Broncos produced 271 total yards and averaged 4.4 yards per play. They also converted 6 of 15 third downs.
What mattered was how Denver’s offensive production appeared at critical moments.
Bo Nix Passing Stats
Bo Nix finished with:
| Statistic | Bo Nix |
| Completions | 18 |
| Attempts | 37 |
| Passing Yards | 173 |
| Average | 4.7 |
| Touchdowns | 2 |
| Interceptions | 1 |
| Sacks | 1 |
| Sack Yards | 2 |
| QBR | 59.1 |
| Passer Rating | 68.9 |
Nix completed 18 of 37 passes, giving him a completion rate of approximately 48.6 percent based on the listed completions and attempts. His 173 passing yards were not a large total, but his two touchdown passes were directly responsible for Denver’s two offensive touchdowns.
The most important part of his performance came late.
His 30-yard touchdown pass to Courtland Sutton gave Denver its first touchdown of the game. Later, Nix connected with RJ Harvey for a 27-yard touchdown that tied the score at 15-15. He then completed the two-point conversion pass to Troy Franklin.
That sequence illustrates why raw passing yardage does not always explain a quarterback’s influence on a game. Nix did not need 300 passing yards to make decisive plays. His two touchdown passes came in high-leverage moments.
At the same time, the interception and relatively low completion percentage show that this was not a statistically clean passing performance. The Broncos won despite offensive inconsistency rather than because they generated overwhelming passing production.
J.K. Dobbins Rushing Stats
J.K. Dobbins led Denver’s rushing attack:
| Statistic | J.K. Dobbins |
| Carries | 15 |
| Rushing Yards | 61 |
| Average | 4.1 |
| Touchdowns | 0 |
| Long Run | 12 yards |
Dobbins accounted for 61 of Denver’s 100 rushing yards. His 4.1 yards per carry was also better than Denver’s overall rushing average of 4.3 only slightly, showing that the Broncos relied on a combination of steady rushing and quarterback mobility rather than one explosive rushing performance.
His workload was important because Denver attempted only 23 team rushing plays. Dobbins received 15 of those carries, giving him the largest share of the Broncos’ traditional rushing workload.
Bo Nix as a Rusher
Nix also contributed significantly on the ground.
He finished with:
- 3 carries
- 36 rushing yards
- 12.0 yards per carry
- 25-yard long run
- 0 rushing touchdowns
His 36 rushing yards were especially valuable because they came on only three attempts. The 25-yard run was Denver’s longest rushing play of the game.
This gave Denver another dimension. While Dobbins handled the majority of the rushing workload, Nix supplied explosive yardage when opportunities appeared.
Denver Broncos Receiving Stats
Denver completed 18 passes for 173 receiving yards and two touchdowns. The passing distribution was relatively spread out, but RJ Harvey and Courtland Sutton produced the touchdowns.
RJ Harvey Receiving Performance
RJ Harvey recorded:
| Statistic | RJ Harvey |
| Receptions | 5 |
| Targets | 5 |
| Receiving Yards | 51 |
| Average | 10.2 |
| Touchdowns | 1 |
| Long Reception | 27 yards |
Harvey’s five receptions made him one of Denver’s most efficient receiving contributors. His biggest play was the 27-yard touchdown reception from Nix in the fourth quarter.
That play tied the game at 15-15 and became one of the defining moments of the matchup.
Harvey also contributed in the return game, recording two kickoff returns for 54 yards with a 27.0-yard average.
Courtland Sutton Receiving Stats
Courtland Sutton had a limited reception total but produced an important explosive play:
- 1 reception
- 6 targets
- 30 receiving yards
- 30.0 yards per reception
- 1 touchdown
- 30-yard long reception
Sutton’s only catch was a 30-yard touchdown from Nix in the second quarter. That reception gave Denver its first touchdown of the afternoon.
The six targets compared with just one reception show that Houston’s defense made it difficult for Denver to consistently complete passes to its top target.
Troy Franklin’s Role
Troy Franklin finished with:
- 4 receptions
- 10 targets
- 27 yards
- 6.8 yards per reception
- 13-yard long reception
- 0 touchdowns
Franklin’s numbers are notable because he received 10 targets, the highest total among Denver receivers listed in the box score. He also caught the successful two-point conversion pass after Harvey’s touchdown.
His contribution was therefore larger than his 27 receiving yards suggest.
Other Denver Receivers
Adam Trautman caught two passes for 25 yards, while Pat Bryant recorded two receptions for 20 yards.
Michael Bandy had one reception for 16 yards, and Tyler Badie recorded two catches for six yards.
Evan Engram was targeted three times but did not record a reception. Dobbins added one reception for negative two yards.
Houston Texans Offensive Player Stats
Houston actually finished with more passing yards than Denver, producing 191 team passing yards compared with Denver’s 171 team passing figure in the ESPN matchup statistics. However, the Texans failed to turn that production into touchdowns.
Houston finished with 268 total yards and 3.7 yards per play.
The Texans also held the ball for 34:36 compared with Denver’s 25:24. Despite having more possession time, Houston could not sustain enough productive drives in the second half.
C.J. Stroud Passing Stats
C.J. Stroud’s statistical line was:
| Statistic | C.J. Stroud |
| Completions | 6 |
| Attempts | 10 |
| Passing Yards | 79 |
| Average | 7.9 |
| Touchdowns | 0 |
| Interceptions | 0 |
| Sacks | 2 |
| Sack Yards | 9 |
| QBR | 81.0 |
| Passer Rating | 85.0 |
Stroud completed six of his 10 attempts for 79 yards before leaving the game after sustaining a concussion during an early slide.
His 7.9 yards per attempt was better than Davis Mills’ 4.6, but his participation was limited.
Davis Mills Passing Stats
Mills took over and finished with:
- 17 completions
- 30 attempts
- 137 yards
- 4.6 yards per attempt
- 0 touchdowns
- 0 interceptions
- 2 sacks
- 16 sack yards
- 50.1 QBR
- 68.3 passer rating
Mills’ lack of interceptions helped Houston avoid additional turnovers, but the offense struggled to generate enough scoring opportunities.
According to the game statistics, Houston went 0-for-3 in the red zone and converted only 3 of 17 third-down attempts. Those numbers provide important context for the final score.
Houston Texans Receiving Stats
Houston’s receivers accumulated 216 receiving yards, compared with Denver’s 173. Yet Houston did not produce a receiving touchdown.
Dalton Schultz
Dalton Schultz led Houston in receiving yardage:
| Statistic | Dalton Schultz |
| Receptions | 6 |
| Targets | 8 |
| Yards | 77 |
| Average | 12.8 |
| Touchdowns | 0 |
| Long | 47 yards |
Schultz’s 47-yard reception was the longest catch by either team in the game. He also caught six passes, giving Houston a reliable outlet through the passing game.
His production was particularly significant because Houston needed consistent completions after Stroud exited.
Nico Collins
Nico Collins finished with:
- 7 receptions
- 11 targets
- 75 yards
- 10.7 yards per reception
- 26-yard long reception
- 0 touchdowns
Collins had the most receptions and targets for Houston.
The combination of Collins and Schultz gave Houston two major sources of receiving production. Together, they accounted for 152 receiving yards.
However, neither player scored, and Houston’s overall passing attack could not convert its yardage into touchdowns.
Other Houston Receivers
Xavier Hutchinson caught three passes for 30 yards.
Christian Kirk added four receptions for 26 yards.
Jayden Higgins recorded one reception for four yards, while Dare Ogunbowale and Harrison Bryant each caught one pass for two yards.
Woody Marks was targeted three times without recording a reception.
Houston Texans Rushing Stats
Houston ran the ball 28 times for 77 yards, producing an average of 2.8 yards per carry. Denver, by comparison, averaged 4.3 yards per rushing attempt.
Nick Chubb
Nick Chubb led Houston’s rushing production:
- 11 carries
- 34 yards
- 3.1 yards per carry
- 0 touchdowns
- 8-yard long
Chubb received the most rushing attempts for Houston, but the Texans could not consistently create efficient rushing plays.
Woody Marks
Woody Marks recorded:
- 10 carries
- 27 yards
- 2.7 yards per carry
- 0 touchdowns
- 7-yard long
Marks and Chubb combined for 21 carries and 61 yards.
That represented most of Houston’s rushing workload, but neither player produced a touchdown.
C.J. Stroud Rushing
Before leaving the game, Stroud had two rushing attempts for 12 yards.
His 6.0 yards per carry was the highest among Houston players with multiple rushing attempts.
Defensive Player Stats
Defense was central to the result.
Denver recorded four sacks, while Houston recorded one. Denver also had seven quarterback hits and seven tackles for loss. Houston produced four quarterback hits and four tackles for loss.
Denver Defensive Leaders
Alex Singleton led Denver with 10 tackles.
Zach Allen delivered one of the most productive defensive performances, recording:
- 6 tackles
- 3 solo tackles
- 1 sack
- 1 tackle for loss
- 2 passes defended
- 3 quarterback hits
Denver’s four total sacks were important because Houston had difficulty maintaining offensive rhythm after Stroud’s departure.
The Broncos also forced Houston into a difficult third-down situation throughout the game. Houston converted only 3 of 17 third-down attempts.
Houston Defensive Leaders
Kamari Lassiter led Houston with nine tackles, including six solo tackles and two passes defended.
Jaylin Pitre recorded seven tackles and also contributed in the defensive effort against Denver’s rushing and short passing game.
Houston recorded one sack and one interception. Calen Bullock intercepted Nix, while Denver did not record an interception.
Despite the takeaway advantage, Houston’s defense could not prevent Denver from scoring 11 points in the fourth quarter.
Special Teams Player Stats
Special teams played an important role in this low-scoring contest.
Wil Lutz
Denver kicker Wil Lutz finished with:
- 1-for-2 on field goals
- 34-yard long
- 1-for-1 on extra points
- 4 points
His final kick was the decisive play. Lutz converted a 34-yard field goal as time expired to give Denver an 18-15 victory.
Ka’imi Fairbairn
Houston kicker Ka’imi Fairbairn had an unusually large role in the scoring:
- 5-for-6 field goals
- 41-yard long
- 15 points
All 15 of Houston’s points came from Fairbairn’s five successful field goals.
That fact explains how Houston could score 15 points despite producing zero touchdowns.
Punting
Denver punter Jeremy Crawshaw recorded eight punts for 428 yards, averaging 53.5 yards per punt. His longest punt traveled 76 yards.
Houston’s Tommy Townsend also punted eight times, producing 420 yards at a 52.5-yard average. His longest punt was 73 yards.
The high number of punts reflected how difficult it was for both offenses to maintain sustained drives.
The Fourth Quarter Changed the Game
The most important section of the Denver Broncos vs Texans match player stats is the fourth quarter.
Denver entered the final period trailing 15-7.
The Broncos then produced an eight-play, 61-yard touchdown drive. Nix connected with Harvey on a 27-yard touchdown pass, and Denver successfully converted the two-point attempt when Nix found Franklin.
That made the score 15-15.
Houston’s offense then failed to create another scoring drive.
Denver eventually received another opportunity and moved into field-goal range. Lutz finished the comeback by converting from 34 yards as time expired.
The Broncos therefore scored all 11 of their fourth-quarter points after being held scoreless in the third quarter.
Third-Down Efficiency Explains the Difference
One of the clearest statistical differences was third-down efficiency.
Denver converted 6 of 15 third downs.
Houston converted only 3 of 17.
That meant Denver converted 40 percent of its third downs, while Houston converted approximately 17.6 percent.
The difference is substantial.
Houston actually possessed the ball for more than nine additional minutes, but possession time did not translate into enough successful drives.
This is an important lesson when analyzing football statistics. Time of possession can show which team controlled the ball, but it does not automatically show which team used its possessions more effectively.
Red-Zone Performance Was Even More Important
Houston reached the red zone three times but did not score a touchdown on any of those opportunities.
Denver reached the red zone once and also did not score a traditional red-zone touchdown. Its touchdowns came from outside the red zone, including Sutton’s 30-yard reception and Harvey’s 27-yard reception.
Houston’s team statistics list the Texans at 0-for-3 in red-zone scoring and Denver at 0-for-1.
That is one of the most unusual features of this game.
Denver scored 18 points without producing a touchdown from a traditional red-zone possession. Houston scored 15 points entirely through field goals.
Turnovers and Field Position
Denver committed two turnovers according to the team statistics, including Nix’s interception and a lost fumble by Michael Bandy. Houston committed zero turnovers.
On paper, that gives Houston a clear advantage.
Yet Denver still won.
This demonstrates that turnover totals should be considered alongside other categories rather than treated as a complete explanation of the result.
Denver compensated with better third-down conversion, stronger rushing efficiency, four sacks, and a decisive fourth-quarter comeback.
Comparing the Main Player Stats
| Category | Denver Leader | Houston Leader |
| Passing Yards | Bo Nix, 173 | Davis Mills, 137 |
| Rushing Yards | J.K. Dobbins, 61 | Nick Chubb, 34 |
| Receiving Yards | RJ Harvey, 51 | Dalton Schultz, 77 |
| Receptions | RJ Harvey, 5 | Nico Collins, 7 |
| Receiving TDs | RJ Harvey, 1 | None |
| Passing TDs | Bo Nix, 2 | None |
| Tackles | Alex Singleton, 10 | Kamari Lassiter, 9 |
| Sacks | Zach Allen, 1 | Team total, 1 |
| Field Goals | Wil Lutz, 1 | Ka’imi Fairbairn, 5 |
This comparison shows that Houston had several individual statistical leaders, particularly in receiving, but Denver generated the touchdowns and the final scoring play.
What the Player Statistics Tell Us
The raw numbers point toward several important conclusions.
Denver Won Through Timely Plays
Denver’s offense was inconsistent for long stretches.
Nix completed fewer than half of his attempts, and Denver produced only 173 passing yards. The Broncos also turned the ball over twice.
But Denver’s biggest passing plays resulted in touchdowns.
Sutton produced a 30-yard touchdown.
Harvey produced a 27-yard touchdown.
Lutz then added the game-winning field goal.
Those high-impact plays made the difference.
Houston Moved the Ball Without Finishing Drives
Houston had 268 total yards and 216 receiving yards.
Collins and Schultz combined for 152 receiving yards, while Fairbairn converted five field goals.
But the Texans did not score a touchdown.
Their 3-for-17 third-down rate and 0-for-3 red-zone touchdown rate made it difficult to protect the lead.
Denver’s Defense Created Pressure
Four Denver sacks compared with one Houston sack.
Zach Allen’s three quarterback hits were especially notable, while the Broncos collectively recorded seven quarterback hits.
Pressure became more important as Houston tried to protect a fourth-quarter lead.
Why the Final Score Was So Close
The 18-15 final score was consistent with the statistical profile of the game.
Neither team reached 300 total yards.
Denver gained 271.
Houston gained 268.
The Broncos averaged 4.4 yards per play.
The Texans averaged 3.7.
Denver rushed for 100 yards.
Houston rushed for 77.
Houston had more passing yards, but Denver generated more rushing efficiency and more defensive pressure.
The result was therefore decided by efficiency rather than overwhelming offensive production.
Key Takeaways From Denver Broncos vs Texans Match Player Stats
The biggest statistical takeaways are:
- Bo Nix threw two touchdown passes, including the fourth-quarter touchdown that tied the game.
- J.K. Dobbins led Denver in rushing with 61 yards on 15 carries.
- RJ Harvey produced the decisive receiving touchdown, finishing with 51 yards.
- Courtland Sutton scored on a 30-yard reception, giving Denver its first touchdown.
- Dalton Schultz led Houston with 77 receiving yards.
- Nico Collins recorded seven catches for 75 yards.
- Ka’imi Fairbairn scored all 15 of Houston’s points.
- Denver recorded four sacks compared with Houston’s one.
- Denver converted 6 of 15 third downs, while Houston converted 3 of 17.
- Houston went 0-for-3 in the red zone.
- Wil Lutz made the game-winning 34-yard field goal as time expired.
How to Read These Statistics Correctly
A box score is most useful when individual numbers are connected to game context.
For example, saying that Collins had 75 receiving yards tells you that he was productive. Adding the fact that Houston had no receiving touchdowns tells you that the production did not result in the same scoring impact as Denver’s passing plays.
Likewise, Nix’s 173 passing yards do not look dominant by themselves. His two touchdown passes and the timing of those touchdowns provide the missing context.
The same principle applies to Fairbairn. His five field goals were a major part of Houston’s scoring, but the lack of touchdowns limited the Texans’ ability to build a larger lead.
This is why Denver Broncos vs Texans match player stats are more useful when viewed as a connected set of numbers rather than as isolated individual totals.
Frequently Asked Questions
Who won the Denver Broncos vs Texans game?
The Denver Broncos defeated the Houston Texans 18-15 on November 2, 2025. Denver scored 11 fourth-quarter points after trailing 15-7 entering the final quarter.
What were Bo Nix’s stats against the Texans?
Bo Nix completed 18 of 37 passes for 173 yards, two touchdowns, and one interception. He also rushed three times for 36 yards.
Who led the Broncos in rushing?
J.K. Dobbins led Denver with 15 carries for 61 yards, averaging 4.1 yards per carry.
Who led the Texans in receiving?
Dalton Schultz led Houston with six receptions for 77 yards. Nico Collins recorded seven receptions for 75 yards.
How many points did Ka’imi Fairbairn score?
Fairbairn scored 15 points by making five of six field-goal attempts. Houston did not score a touchdown.
How did the Broncos win the game?
Denver tied the game at 15-15 with a fourth-quarter touchdown pass from Bo Nix to RJ Harvey followed by a successful two-point conversion. Wil Lutz then made a 34-yard field goal as time expired to give Denver an 18-15 victory.
Conclusion
The Denver Broncos vs Texans match player stats show a game decided by execution in critical moments rather than by overwhelming offensive production.
Denver finished with 271 total yards and Houston had 268. Houston produced more passing yardage and held the ball longer, while Denver generated more rushing yards per attempt, more sacks, and better third-down efficiency.
Bo Nix finished with two touchdown passes, while J.K. Dobbins provided the foundation of Denver’s rushing attack. RJ Harvey delivered the fourth-quarter touchdown that brought the Broncos level, and Courtland Sutton supplied Denver’s other touchdown on a 30-yard reception.
For Houston, Dalton Schultz and Nico Collins were productive through the air, while Ka’imi Fairbairn accounted for all 15 points with five field goals. The Texans’ biggest statistical problems were their inability to convert third downs and their failure to turn three red-zone possessions into touchdowns.
The final 18-15 score reflects the nature of the contest. Denver did not dominate the box score, but the Broncos made enough high-value plays late in the game to overcome an eight-point fourth-quarter deficit and finish with the victory.