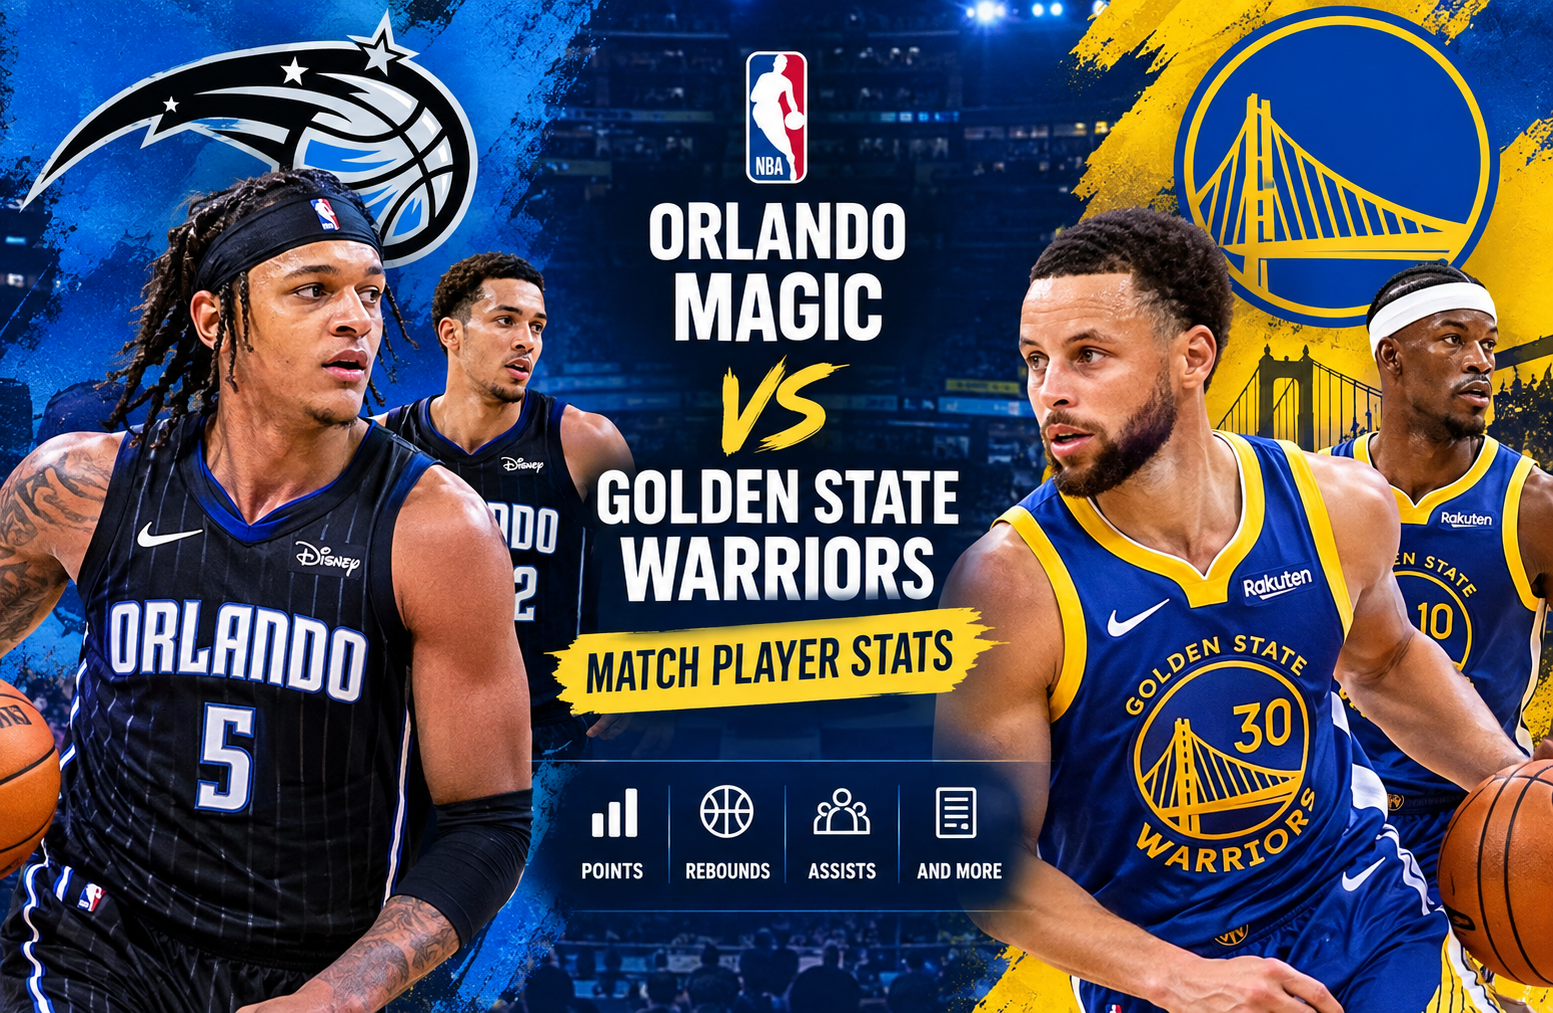
Orlando Magic vs Golden State Warriors Match Player Stats
Orlando Magic vs Golden State Warriors match player stats tell a much deeper story than the final 120-97 score alone. Golden State controlled the second half, converted 51.7% of its field goals, created 33 assists, and forced Orlando into 18 turnovers. The Magic had strong individual performances from Paolo Banchero, Desmond Bane, and Anthony Black, but their offense became increasingly difficult to sustain as the game progressed.
The matchup took place at Chase Center in San Francisco, with an announced attendance of 18,064. Golden State entered the game with a 15-15 record and a 9-4 home mark, while Orlando arrived at 16-13 overall and 6-8 on the road.
For anyone looking beyond the headline score, this game is especially useful because it shows how a close contest can turn into a decisive result without one team dominating every statistical category. Orlando actually led after the opening quarter, but Golden State changed the rhythm of the game in the second half. The Warriors finished with a 23-point margin, and their advantages in shooting efficiency, ball movement, paint scoring, and turnover creation became increasingly important.
Orlando Magic vs Golden State Warriors match player stats
The individual numbers explain why the game remained competitive for stretches and why Golden State eventually pulled away.
Paolo Banchero led Orlando with 21 points, 12 rebounds, and 7 assists. His all-around production stands out because he contributed in three of the most important statistical areas. He also shot 7 of 19 from the field and made 7 of 8 free throws.
Desmond Bane added 20 points on an efficient 8-of-16 shooting performance. He made both of his three-point attempts and finished with 4 rebounds, 3 assists, and 2 blocks.
Anthony Black scored 19 points and provided another important scoring option for Orlando.
For Golden State, Stephen Curry led all scorers with 26 points. He also recorded 6 assists and 2 steals. Curry shot 10 of 23 overall and made 4 of 13 attempts from three-point range.
Jimmy Butler III scored 21 points on 7-of-9 shooting. He was particularly efficient, making 77.8% of his field-goal attempts and 85.7% of his free throws.
Moses Moody supplied another 20 points for Golden State.
Quinten Post led the Warriors with 12 rebounds, while Brandin Podziemski finished with a team-high plus/minus of +36.
Player statistics at a glance
| Player | Team | Points | Rebounds | Assists |
| Stephen Curry | Golden State | 26 | Not listed in supplied summary | 6 |
| Paolo Banchero | Orlando | 21 | 12 | 7 |
| Jimmy Butler III | Golden State | 21 | 3 | 4 |
| Desmond Bane | Orlando | 20 | 4 | 3 |
| Moses Moody | Golden State | 20 | Not listed in supplied summary | Not listed |
| Anthony Black | Orlando | 19 | Not listed in supplied summary | Not listed |
| Quinten Post | Golden State | 8 | 12 | 4 |
The official box score also shows that Butler shot 7 of 9 from the field, while Banchero posted 21 points, 12 rebounds, and 7 assists. Official NBA player box score
Final score and quarter-by-quarter breakdown
Golden State won 120-97, but the quarter scores show that the game was not a 48-minute blowout.
| Quarter | Orlando Magic | Golden State Warriors |
| 1st | 30 | 26 |
| 2nd | 27 | 32 |
| 3rd | 26 | 31 |
| 4th | 14 | 31 |
| Total | 97 | 120 |
Orlando won the opening quarter 30-26. That is an important detail because it shows the Magic were able to establish an offensive rhythm early.
Golden State responded in the second quarter, outscoring Orlando 32-27. The Warriors then extended the advantage in the third quarter by winning that period 31-26.
The fourth quarter was where the scoreboard became decisive. Golden State scored 31 points while Orlando managed only 14.
That 17-point fourth-quarter difference explains a large portion of the final margin.
It also changes how the game should be interpreted. Looking only at the final score can make it appear that Golden State controlled the entire contest. The quarter-by-quarter numbers show something more specific: Orlando competed early, Golden State gradually gained control, and the fourth quarter turned the game into a comfortable win.
How Golden State turned the game around
The Warriors’ comeback from the first-quarter deficit was built around several connected factors rather than one statistic.
First, Golden State improved its shooting efficiency. The Warriors finished at approximately 52% from the field, compared with 41% for Orlando.
That 11-percentage-point difference is substantial over a full game.
Golden State attempted 89 field goals and made 46. Orlando attempted 87 and made 36. The difference was only two field-goal attempts, but Golden State converted 10 more shots.
That is the clearest statistical explanation for the scoring gap.
Golden State also recorded 33 assists compared with 21 for Orlando. The 12-assist advantage indicates a significant difference in offensive ball movement.
The Warriors did not need to rely exclusively on difficult individual shots. Their passing helped create additional efficient opportunities.
The team also scored 62 points in the paint, compared with 50 for Orlando. That 12-point advantage helped compensate for Golden State’s relatively modest three-point percentage.
This is an important part of the matchup because the Warriors did not win simply by shooting a high percentage from outside.
They made 11 of 37 three-point attempts, or 29.7%.
Orlando made 7 of 27, or approximately 26%.
Neither team was particularly efficient from three-point range. Golden State’s advantage came from being better overall from the field and generating more effective offense inside the arc.
Stephen Curry’s 26-point performance
Stephen Curry finished with 26 points, making him the game’s leading scorer.
His final shooting line was 10 of 23 from the field and 4 of 13 from three-point range. He also made 2 of 2 free throws, according to the official game record.
Curry’s performance is especially interesting because his scoring was not evenly distributed across the game.
He had a difficult first half before finding his rhythm after halftime. The game recap reports that he scored 18 of his 26 points after intermission.
That second-half production matched Golden State’s overall change in momentum.
Curry also contributed 6 assists and 2 steals. Those numbers matter because his influence was not limited to scoring.
A point guard can affect a game through shot creation, passing, spacing, and defensive activity. Curry’s six assists were part of Golden State’s 33-assist team total.
His four made three-pointers were also important, even though he needed 13 attempts to reach that total.
From an efficiency perspective, Curry’s 26 points were not built around an elite shooting percentage. His larger contribution came from scoring volume combined with playmaking and the way his second-half offense coincided with Golden State’s strongest stretch.
Paolo Banchero’s all-around contribution
Paolo Banchero was Orlando’s most complete statistical performer.
He scored 21 points, grabbed 12 rebounds, and delivered 7 assists.
That produced a 21-12-7 line that demonstrates how heavily Orlando relied on him.
Banchero shot 7 of 19 from the field, or 36.8%. He did most of his damage from the free-throw line, where he made 7 of 8 attempts.
His three-point shooting was not productive in this game. He went 0 for 4 from beyond the arc.
That combination creates an interesting contrast.
Banchero still reached 21 points despite making no three-pointers because he contributed through two-point scoring, free throws, rebounding, and playmaking.
His seven assists were particularly valuable because Orlando finished with only 21 assists as a team.
In other words, Banchero was responsible for a significant portion of the Magic’s playmaking output.
His 12 rebounds also led Orlando.
For a team that was struggling to maintain its offensive efficiency, having a forward contribute across several categories helped prevent the game from getting away earlier.
Jimmy Butler III provides efficient scoring
Jimmy Butler III scored 21 points for Golden State and was arguably one of the most efficient high-volume scorers in the game.
He made 7 of 9 field-goal attempts, including his only three-point attempt. He also made 6 of 7 free throws.
That gave him a 77.8% field-goal percentage.
Butler also added 3 rebounds, 4 assists, and 1 block.
The significance of his performance goes beyond his 21 points.
Golden State had three players reach at least 20 points: Curry with 26, Butler with 21, and Moody with 20.
That distribution made it harder for Orlando to concentrate its defensive attention on one scorer.
When Curry was struggling early, other Warriors players were still able to produce.
That balance became increasingly valuable as the game moved into the second half.
Desmond Bane’s scoring efficiency
Desmond Bane scored 20 points for Orlando and was one of the Magic’s more efficient offensive contributors.
He made 8 of 16 field-goal attempts for 50% shooting. He also made both of his three-point attempts and finished 2 of 3 at the free-throw line.
Bane added 4 rebounds, 3 assists, and 2 blocks.
His 20 points gave Orlando another reliable scoring option alongside Banchero.
However, the overall team shooting numbers show the problem Orlando faced.
Bane shot 50%, but the Magic as a team shot only 41%.
That difference illustrates why individual efficiency does not always translate directly into team success. Basketball possessions are shared across the lineup, and the team’s overall shot quality, turnovers, rebounding, and passing all contribute to the final result.
Moses Moody adds another scoring layer
Moses Moody scored 20 points for Golden State.
His contribution was important because it gave the Warriors another player capable of reaching a substantial scoring total.
With Curry scoring 26 and Butler scoring 21, Moody’s 20 points meant Golden State had three players at 20 or more.
Orlando had Banchero at 21, Bane at 20, and Black at 19.
That comparison is surprisingly close at the top.
The difference was not simply that Golden State had better leading scorers. The Warriors also received more efficient shooting and more collective offensive production.
The shooting battle
The shooting statistics provide perhaps the clearest numerical explanation for the result.
| Category | Orlando | Golden State |
| Field Goals | 36-87 | 46-89 |
| Field Goal % | 41% | 52% |
| Three-Pointers | 7-27 | 11-37 |
| Three-Point % | 26% | 30% |
| Free Throws | 18-26 | 17-24 |
| Free Throw % | 69% | 71% |
Golden State made 10 more field goals despite taking only two more attempts.
That is a major efficiency advantage.
The Warriors also made four more three-pointers.
Orlando actually made one more free throw than Golden State, but the difference at the free-throw line was not large enough to offset the field-goal gap.
The most important takeaway is that Golden State won the shooting battle in several layers.
The Warriors were better from the field overall.
They were slightly better from three.
They were also slightly better at the free-throw line.
None of those differences alone explains a 23-point victory. Together, they created a large efficiency gap.
Turnovers changed the game
Orlando committed 18 turnovers, while Golden State committed 13.
That five-turnover difference produced another important advantage for the Warriors.
Golden State scored 21 points off Orlando turnovers.
That means Orlando’s mistakes did not merely end possessions. They directly created scoring opportunities for Golden State.
This is one of the most actionable statistics in the game because turnovers can create rapid swings in momentum.
An offensive possession that ends with a missed shot gives the defense a chance to secure the rebound.
A turnover can immediately give the opponent the ball in a more favorable situation, particularly when it leads to transition offense.
The five-turnover difference therefore had a larger impact than the raw number suggests.
Orlando’s 18 turnovers were also far above Golden State’s 13.
The Magic had 21 assists against those 18 turnovers, while Golden State recorded 33 assists against only 13 turnovers.
That creates a major contrast in offensive ball security.
Assist-to-turnover comparison
A simple way to evaluate offensive organization is to compare assists with turnovers.
Orlando:
21 assists
18 turnovers
Golden State:
33 assists
13 turnovers
Golden State’s ratio was dramatically stronger.
The Warriors generated more than two and a half assists for every turnover, while Orlando produced only slightly more than one assist per turnover.
This statistic helps explain why Golden State was able to sustain offensive pressure.
The Warriors moved the ball more effectively while also protecting possessions better.
Orlando, meanwhile, had several individual contributors, but the team struggled to turn those contributions into consistently efficient possessions.
Rebounding was almost even
One of the most interesting aspects of the box score is that rebounding did not decide the game.
Orlando collected 48 rebounds.
Golden State collected 47.
The Magic therefore had a one-rebound advantage.
This matters because it removes one common explanation for the 23-point difference.
Golden State did not win because it dominated the glass.
In fact, Orlando’s rebounding total was slightly higher.
Paolo Banchero’s 12 rebounds were particularly important, while Quinten Post also grabbed 12 for Golden State.
The nearly identical team totals indicate that shooting efficiency, ball movement, turnovers, and offensive execution were much more important factors.
Paint scoring was another major difference
Golden State scored 62 points in the paint.
Orlando scored 50.
That created a 12-point advantage for the Warriors.
The number is notable because Golden State did not need an extraordinary three-point shooting night to create offensive separation.
The Warriors made only 29.7% of their threes.
Instead, they combined moderate perimeter shooting with strong overall field-goal efficiency and 62 points in the paint.
This is a useful lesson when interpreting NBA box scores.
A team can win a game convincingly without having a spectacular three-point percentage if it consistently creates efficient shots elsewhere.
Orlando’s fourth-quarter collapse
The fourth quarter deserves separate attention because Orlando scored only 14 points.
Golden State scored 31.
That created a 17-point difference in one quarter.
A 14-point offensive output is particularly costly when the opponent is scoring at a high rate.
Orlando had already fallen behind during the second and third quarters, but the fourth quarter removed any realistic path back into the contest.
The quarter also illustrates the value of offensive consistency.
Golden State scored at least 31 points in both the third and fourth quarters.
Orlando scored 26 in the third before dropping to 14 in the fourth.
The game therefore ended with a dramatic divergence in offensive production.
Brandin Podziemski and the plus/minus story
Brandin Podziemski recorded a team-high plus/minus of +36.
Plus/minus should always be interpreted carefully.
It does not isolate an individual player’s contribution in the same way that points, rebounds, or assists do.
Instead, it tracks the team’s scoring margin while that player is on the court.
Still, a +36 mark in a 23-point team victory is notable.
It indicates that Golden State’s strongest stretches occurred with Podziemski on the floor.
He also recorded 16 points, 5 assists, and 4 rebounds.
That combination helps explain why his overall impact went beyond his scoring total.
The defensive activity
Both teams recorded 8 steals.
Golden State added 6 blocks, while Orlando recorded 5.
The raw steal totals were therefore identical.
The difference was what happened after defensive plays.
Golden State forced 18 Orlando turnovers and converted many of those mistakes into offense.
Orlando forced 13 turnovers from the Warriors.
That five-turnover advantage contributed directly to the Warriors’ 21 points off turnovers.
Tyus Jones led Orlando with 4 steals.
Golden State’s steals were distributed among several players. Curry, De’Anthony Melton, and Gary Payton II each recorded 2.
That distribution is another example of Golden State’s collective approach.
Season series context
The two teams split their season meetings 1-1.
Golden State won the first meeting 121-113 on November 19, 2025.
The Warriors then won the second meeting 120-97 on December 23 in the supplied game record.
The two results show a clear scoring pattern.
Game 1:
Golden State 121
Orlando 113
Game 2:
Golden State 120
Orlando 97
Across the two meetings, Golden State scored 241 points while Orlando scored 210.
The Warriors therefore held a combined 31-point scoring advantage across the season series.
The second meeting was considerably more one-sided than the first.
That makes the December game particularly useful for examining how the matchup changed from one meeting to the next.
What the team statistics reveal
The complete team statistical picture can be summarized as follows:
| Statistic | Orlando Magic | Golden State Warriors |
| Points | 97 | 120 |
| FG | 36-87 | 46-89 |
| FG% | 41% | 52% |
| 3PT | 7-27 | 11-37 |
| 3PT% | 26% | 30% |
| FT | 18-26 | 17-24 |
| FT% | 69% | 71% |
| Rebounds | 48 | 47 |
| Assists | 21 | 33 |
| Turnovers | 18 | 13 |
| Steals | 8 | 8 |
| Blocks | 5 | 6 |
Several conclusions can be drawn without relying on a single statistic.
- Golden State was much more efficient from the field.
- Golden State created 12 more assists.
- Golden State committed five fewer turnovers.
- Golden State scored 12 more points in the paint.
Orlando collected one more rebound.
Both teams recorded eight steals.
The final score was therefore driven primarily by offensive efficiency and possession quality rather than rebounding or steals.
Why the final margin was so large
A 23-point victory usually requires several advantages to overlap.
That is exactly what happened here.
Golden State had:
- 10 more made field goals
- 4 more made three-pointers
- 12 more assists
- 5 fewer turnovers
- 12 more paint points
- A 17-point advantage in the fourth quarter
Orlando had:
- 1 more rebound
- 1 more made free throw
- Three players scoring at least 19 points
The Magic were not completely overwhelmed statistically.
Instead, they lost the categories that tend to compound over the course of a game.
Missing shots reduces scoring.
Turnovers remove possessions.
Lower assist totals can reduce shot quality.
When those issues occur simultaneously, a team can remain competitive for three quarters before the deficit grows rapidly.
Orlando’s biggest statistical positives
Despite the loss, several parts of Orlando’s performance were productive.
Paolo Banchero’s versatility
Banchero’s 21 points, 12 rebounds, and 7 assists made him Orlando’s most complete contributor.
Desmond Bane’s efficiency
Bane scored 20 points on 50% shooting and made both of his three-point attempts.
Anthony Black’s scoring
Black added 19 points, giving Orlando three players within two points of one another at the top of the scoring chart.
Rebounding
Orlando finished with 48 rebounds, one more than Golden State.
Tyus Jones’ steals
Jones led the Magic with four steals, demonstrating active defensive involvement.
These positives show that Orlando had meaningful individual production even though the overall offensive structure could not match Golden State’s efficiency.
Golden State’s biggest statistical positives
Golden State also had several clear strengths.
Balanced scoring
Curry scored 26, Butler scored 21, and Moody scored 20.
Efficient shooting
The Warriors shot 51.7% from the field.
Ball movement
Golden State produced 33 assists.
Ball security
The Warriors committed only 13 turnovers.
Paint scoring
Golden State scored 62 points in the paint.
Second-half production
The Warriors scored 63 points after halftime.
Those categories collectively explain why Golden State was able to turn a four-point first-quarter deficit into a 23-point victory.
What the matchup says about offensive execution
The most useful lesson from this game is that scoring totals need context.
Orlando had three players with 19 or more points.
Golden State also had three players with 20 or more.
At first glance, the scoring distribution looks fairly balanced.
The difference was what happened around those leading scorers.
Golden State’s supporting structure produced more assists, fewer turnovers, higher field-goal efficiency, and more points in the paint.
That means the Warriors did not necessarily win because their top players simply scored much more.
They won because their overall possessions were more productive.
This is why a detailed box-score analysis is more useful than looking only at the leading scorer.
What fans should look for in similar matchups
When evaluating future Orlando and Golden State games, several statistics from this matchup are worth monitoring.
Field-goal percentage
An 11-point gap in field-goal percentage is difficult to overcome.
Turnovers
The five-turnover difference here became 21 Warriors points off Orlando mistakes.
Assists
The 33-21 assist gap indicates a major difference in offensive creation.
Paint points
Golden State’s 62-50 advantage demonstrates that perimeter shooting was not the only source of scoring separation.
Fourth-quarter offense
The 31-14 fourth-quarter difference shows how quickly a competitive game can become one-sided.
These are more informative indicators than focusing only on the final score.
Orlando Magic vs Golden State Warriors match player stats: key takeaways
The most important individual and team numbers from the matchup are straightforward.
Stephen Curry led all scorers with 26 points and added six assists.
Paolo Banchero led Orlando with 21 points, 12 rebounds, and seven assists.
Jimmy Butler III scored 21 points while shooting 77.8% from the field.
Desmond Bane scored 20 points on 50% shooting.
Moses Moody added 20 points.
Anthony Black scored 19.
Quinten Post led Golden State with 12 rebounds.
Brandin Podziemski recorded a team-best +36 plus/minus.
Golden State shot approximately 52% from the field compared with Orlando’s 41%.
The Warriors recorded 33 assists against Orlando’s 21.
Golden State committed 13 turnovers compared with Orlando’s 18.
The Warriors scored 62 points in the paint compared with 50 for the Magic.
Most importantly, Golden State outscored Orlando 62-40 across the fourth quarter and second half? More precisely, the Warriors scored 63 second-half points compared with Orlando’s 40, which shows where the game truly separated.
Frequently Asked Questions
Who was the top scorer in the Orlando Magic vs Golden State Warriors game?
Stephen Curry was the game’s leading scorer with 26 points. He also recorded six assists and two steals for Golden State.
How many points did Paolo Banchero score?
Paolo Banchero scored 21 points. He also collected 12 rebounds and seven assists, making him Orlando’s leading rebounder and assist provider.
What was the final score between Orlando and Golden State?
The Golden State Warriors defeated the Orlando Magic 120-97 at Chase Center.
Who had the most rebounds in the game?
Paolo Banchero and Quinten Post each recorded 12 rebounds, making them the leading rebounders for their respective teams.
How many assists did Golden State have?
Golden State recorded 33 assists, compared with 21 assists for Orlando.
How did Golden State win by 23 points?
The Warriors combined 51.7% field-goal shooting with 33 assists, 13 turnovers, 62 paint points, and a 31-14 fourth quarter. Orlando shot 41% and committed 18 turnovers.
Conclusion
Orlando Magic vs Golden State Warriors match player stats from this game show why a box score should be read as a connected statistical story rather than a list of isolated numbers.
Paolo Banchero delivered an impressive all-around line with 21 points, 12 rebounds, and seven assists. Desmond Bane added 20 points, while Anthony Black contributed 19. Orlando also held a narrow rebounding advantage and received meaningful defensive activity from Tyus Jones.
Golden State, however, produced the more efficient team performance. Stephen Curry led all scorers with 26 points, Jimmy Butler III added 21 on highly efficient shooting, and Moses Moody scored 20. Quinten Post controlled the glass for the Warriors with 12 rebounds, while Brandin Podziemski finished with a team-best +36 plus/minus.
The most important numbers were the team statistics. Golden State shot 51.7% from the field compared with Orlando’s 41%, produced 33 assists against 21, committed five fewer turnovers, and scored 12 more points in the paint.
The quarter scores provide the final piece of the explanation. Orlando led 30-26 after the first quarter, but Golden State won the next three periods. The decisive stretch came in the fourth, when the Warriors scored 31 points while the Magic scored only 14.
For readers studying the matchup, the biggest lesson is that Golden State’s victory was built through cumulative advantages. Shooting efficiency, passing, ball security, interior scoring, and second-half execution all moved in the same direction. Orlando had strong individual performances, but those contributions were not enough to overcome the Warriors’ overall efficiency.
The season series finished 1-1 in the supplied data, with Golden State winning both listed meetings. The second contest therefore provides a useful snapshot of how individual production can remain competitive while team-level efficiency determines the final result.