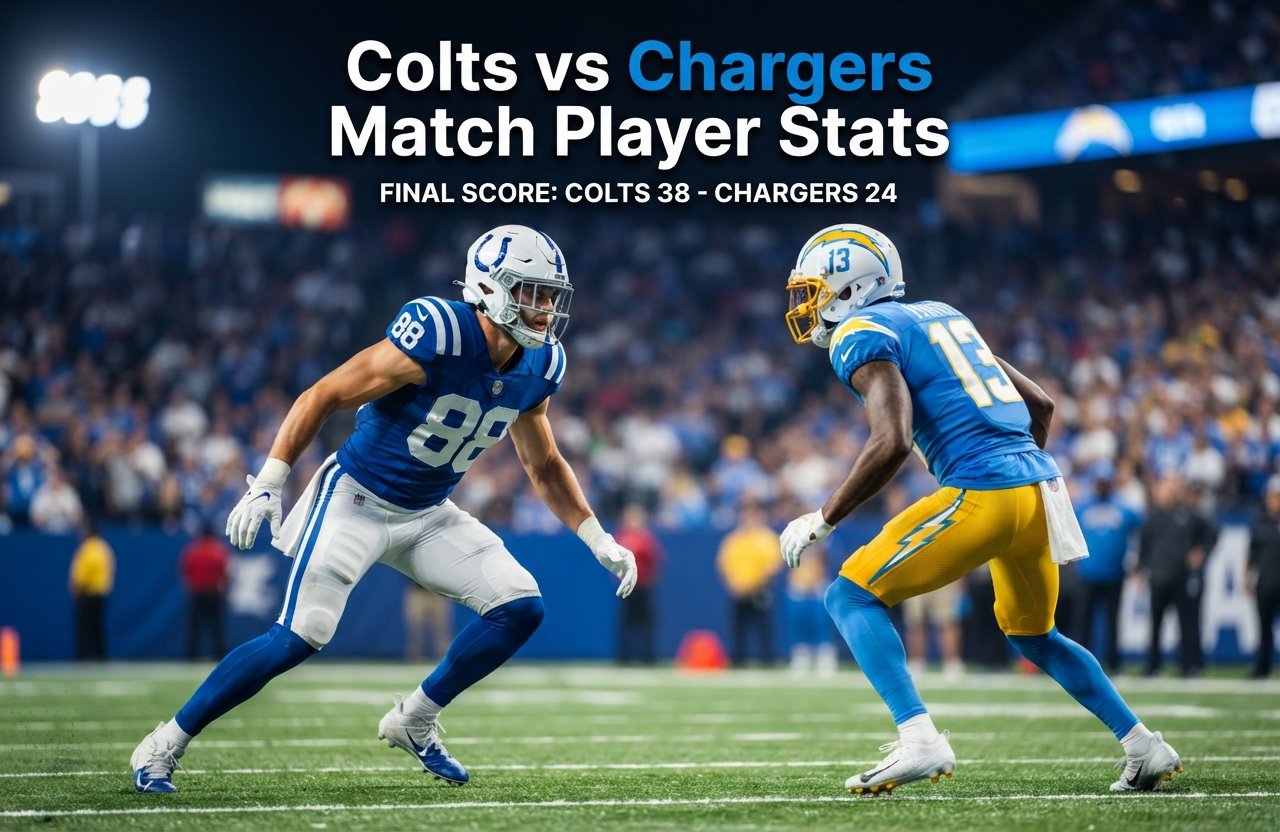
Colts vs Chargers Match Player Stats
The colts vs chargers match player stats from October 20, 2025, tell the story of an impressive Indianapolis Colts victory, as the Colts defeated the Los Angeles Chargers 38-24. Indianapolis built its advantage through a productive rushing attack, efficient quarterback play, and timely defensive takeaways. Los Angeles produced more passing yards, but its two interceptions and inability to establish a consistent ground game made the difference in a game that swung heavily in Indianapolis’s favor before halftime.
Jonathan Taylor was the standout performer for the Colts, rushing for 94 yards and three touchdowns on 16 carries. Quarterback Daniel Jones completed 23 of 34 passes for 288 yards and two touchdowns without throwing an interception. On the Chargers’ side, Justin Herbert threw for 420 yards and three touchdowns, while rookie tight end Oronde Gadsden delivered a major receiving performance with 164 yards and a touchdown.
The final score reveals an important lesson about NFL football: accumulating passing yards does not automatically translate into winning. Indianapolis balanced its offense, capitalized on defensive opportunities, and built a lead that Los Angeles could not erase. Examining the individual statistics, team totals, scoring sequence, and decisive plays helps explain how the Colts earned the 14-point victory.
Match Overview: Indianapolis Colts vs Los Angeles Chargers
The game took place on October 20, 2025. Indianapolis entered the matchup with a 6-1 overall record, while Los Angeles had a 4-3 record. The Colts ultimately improved their position with a 38-24 win.
| Match Detail | Information |
| Matchup | Indianapolis Colts vs. Los Angeles Chargers |
| Date | October 20, 2025 |
| Final score | Colts 38, Chargers 24 |
| Winning team | Indianapolis Colts |
| Losing team | Los Angeles Chargers |
| Colts’ pregame record | 6-1 |
| Chargers’ pregame record | 4-3 |
| Colts’ passing leader | Daniel Jones |
| Chargers’ passing leader | Justin Herbert |
| Colts’ rushing leader | Jonathan Taylor |
| Chargers’ leading receiver | Oronde Gadsden |
| Official box score | ESPN Australia NFL Box Score |
Indianapolis won despite having substantially fewer passing yards than its opponent. The Colts’ offense generated 288 passing yards and 120 rushing yards, while the Chargers recorded 420 passing yards and only 54 rushing yards.
That contrast is central to understanding the result. Indianapolis found multiple ways to score, whereas Los Angeles relied heavily on its passing game. The Colts also recorded two interceptions, giving their defense a direct role in the outcome.
Colts vs Chargers Match Player Stats: Quarter-by-Quarter Scoring
The scoring pattern shows how Indianapolis established control and why the Chargers faced such a difficult comeback.
| Quarter | Indianapolis Colts | Los Angeles Chargers |
| First quarter | 6 | 3 |
| Second quarter | 17 | 0 |
| Third quarter | 15 | 14 |
| Fourth quarter | 0 | 7 |
| Final score | 38 | 24 |
Indianapolis scored 23 points before halftime, while Los Angeles managed just three. The Colts then added another 15 points in the third quarter, creating a substantial advantage before the Chargers’ offense began making up ground.
The Chargers won the scoring battle in both the third and fourth quarters combined, producing 21 points to Indianapolis’s 15. However, the deficit created earlier was too large to overcome.
First Quarter: Indianapolis Takes the Early Advantage
The Colts scored six points in the opening quarter, compared with three for the Chargers. Although neither team established a decisive lead immediately, Indianapolis began building the advantage that would grow significantly in the second period.
The opening quarter also highlighted the value of making the most of scoring opportunities. A close start can develop into a comfortable lead when one offense sustains productive possessions and the opposing team struggles to finish drives.
Second Quarter: The Colts Create Separation
The second quarter was the defining period of the game. Indianapolis scored 17 unanswered points during the quarter, while Los Angeles failed to score.
This was where the Colts transformed a competitive contest into a matchup that increasingly favored their style of play. The combination of Daniel Jones’s passing efficiency and Jonathan Taylor’s scoring production gave Indianapolis several ways to threaten the Chargers’ defense.
For Los Angeles, the scoreline created a tactical problem. The Chargers needed to recover points quickly, increasing the importance of passing plays and reducing the freedom to rely on a slower, balanced offensive approach.
Third Quarter: The Chargers Respond, but Indianapolis Maintains Control
Los Angeles scored 14 points in the third quarter, showing that its passing attack could produce results. Indianapolis answered with 15 points, however, preventing the Chargers from making meaningful progress on the scoreboard.
This quarter illustrates the difference between offensive production and game control. The Chargers found scoring opportunities, but the Colts continued to answer them. When a team is already behind by a large margin, trading touchdowns does not necessarily improve its chances of winning.
Fourth Quarter: Los Angeles Finishes Stronger, but Too Late
The Chargers scored seven points in the final quarter, while the Colts did not add to their total.
The late scoring helped Los Angeles make the final margin more respectable, but it could not undo the damage from the second and third quarters. Indianapolis had already accumulated enough points to protect its lead through the closing period.
Quarterback Comparison: Daniel Jones vs Justin Herbert
The quarterback statistics provide one of the clearest explanations for the different offensive approaches used by the two teams. Justin Herbert produced more passing yards and touchdowns, but Daniel Jones delivered the more efficient performance in terms of protecting the football and supporting a winning game plan.
Daniel Jones
Indianapolis Colts
113.4
Passer rating
- 23 completions on 34 attempts
- 288 passing yards
- 2 passing touchdowns
- 0 interceptions
- 90.5 QBR
Los Angeles Chargers v Las Vegas Raiders – NFL 2025
Justin Herbert
Los Angeles Chargers
93.0
Passer rating
- 37 completions on 55 attempts
- 420 passing yards
- 3 passing touchdowns
- 2 interceptions
- 52.9 QBR
Daniel Jones: Efficiency Without Turnovers
Jones completed 23 of 34 attempts, giving him a completion rate of approximately 67.6%. His 288 passing yards represented an average of 8.5 yards per attempt, while two touchdown passes helped Indianapolis convert its offensive opportunities into points.
His most important statistical achievement was avoiding interceptions. Against a Chargers team that needed to generate stops and regain possession, Jones’s ball security limited the opportunities for Los Angeles to change the game’s momentum.
His 113.4 passer rating and 90.5 QBR also reflected a productive overall performance according to the supplied game data.
Jones was not required to match Herbert’s passing volume. Indianapolis could use Taylor’s rushing production to keep the offense balanced, making it easier to avoid putting the entire result on the quarterback’s shoulders.
Justin Herbert: Impressive Yardage, Costly Interceptions
Herbert completed 37 of 55 passes for 420 yards and three touchdowns. His completion rate was approximately 67.3%, and he averaged 7.6 yards per attempt.
Those numbers demonstrate that Herbert moved the football effectively through the air. His 420 yards exceeded Jones’s total by 132 yards, and his three touchdown passes were one more than the Colts quarterback recorded.
However, Herbert also threw two interceptions and was sacked three times for a combined loss of 29 yards. These negative plays reduced the overall value of his passing production.
The distinction matters because passing yards measure advancement of the football, not the complete value of every possession. A quarterback can accumulate substantial yardage while still facing problems with turnovers, pressure, or the timing of scoring drives.
Passing Statistics Compared
| Passing Statistic | Daniel Jones | Justin Herbert |
| Completions | 23 | 37 |
| Attempts | 34 | 55 |
| Completion percentage | 67.6% | 67.3% |
| Passing yards | 288 | 420 |
| Yards per attempt | 8.5 | 7.6 |
| Passing touchdowns | 2 | 3 |
| Interceptions | 0 | 2 |
| Sacks taken | 1 | 3 |
| Sack yards lost | 7 | 29 |
| Passer rating | 113.4 | 93.0 |
| QBR | 90.5 | 52.9 |
The most revealing comparison is the combination of yards per attempt and turnovers. Jones averaged more yards per attempt and did not throw an interception, while Herbert had more total production but also more costly mistakes.
These figures do not mean that Jones was better at every aspect of quarterback play. Herbert faced a game situation that required more passing, which partly explains the difference in attempts. Nevertheless, Jones’s ability to generate efficient offense without surrendering possession was a major advantage for Indianapolis.
Jonathan Taylor Leads the Colts’ Rushing Attack
Jonathan Taylor was the most influential individual scorer in the game. He carried the ball 16 times for 94 yards and three rushing touchdowns, averaging 5.9 yards per attempt.
His production gave Indianapolis a dependable alternative to the passing game. Rather than relying exclusively on Jones to move the offense, the Colts could attack the Chargers on the ground and use Taylor to finish scoring opportunities.
Colts Rushing Statistics
| Player | Carries | Rushing Yards | Yards per Carry | Rushing TDs | Longest Run |
| Jonathan Taylor | 16 | 94 | 5.9 | 3 | 23 yards |
| Ameer Abdullah | 2 | 19 | 9.5 | 0 | 14 yards |
| Daniel Jones | 5 | 7 | 1.4 | 0 | 7 yards |
| Team total | 23 | 120 | 5.2 | 3 | 23 yards |
Why Taylor’s Three Touchdowns Mattered
Taylor’s 94 rushing yards were important, but his three touchdowns were even more significant to the final result. Touchdowns directly turn offensive possessions into points, and Taylor supplied Indianapolis with three rushing scores.
His 5.9 yards per carry also indicates that his impact was not limited to short goal-line runs. He produced useful yardage throughout his carries, helping the Colts sustain their ground attack.
From a tactical perspective, a productive running back can influence the defense even when he does not receive the ball. Defenders must respect the possibility of a handoff, which can create opportunities for play-action passing and other offensive variations.
The supplied statistics do not establish exactly how many defensive players were committed to stopping Taylor on each snap. Still, the combination of his rushing average and scoring output shows why the Colts could maintain a balanced offensive approach.
Ameer Abdullah Adds Useful Depth
Abdullah recorded two carries for 19 yards, averaging 9.5 yards per attempt. His longest run covered 14 yards.
Although his workload was much smaller than Taylor’s, Abdullah added another productive element to the Colts’ rushing totals. His contribution also demonstrates why team rushing figures should not be attributed entirely to the leading running back.
Jones added seven rushing yards on five carries. His numbers were modest, but his mobility provided an additional option when plays developed outside the intended passing structure.
Chargers Rushing Statistics: A Limited Ground Game
The Chargers produced only 54 rushing yards on 16 attempts, averaging 3.4 yards per carry. Unlike Indianapolis, Los Angeles did not record a rushing touchdown.
| Player | Carries | Rushing Yards | Yards per Carry | Rushing TDs | Longest Run |
| Justin Herbert | 6 | 31 | 5.2 | 0 | 11 yards |
| Kimani Vidal | 9 | 20 | 2.2 | 0 | 5 yards |
| Hassan Haskins | 1 | 3 | 3.0 | 0 | 3 yards |
| Team total | 16 | 54 | 3.4 | 0 | 11 yards |
Herbert Provides Most of the Rushing Production
Herbert led the Chargers in rushing with 31 yards on six carries. His 5.2 yards per carry suggests that he could create some value with his legs when the opportunity arose.
However, a quarterback’s rushing production cannot fully replace a productive running back rotation. Herbert was already responsible for a heavy passing workload, completing 55 attempts. Depending on quarterback runs to supply additional yardage can place more demands on the player responsible for leading the passing attack.
Kimani Vidal Struggles to Establish Consistency
Vidal carried the ball nine times for 20 yards, averaging 2.2 yards per carry. His longest run was only five yards.
This limited production made it difficult for Los Angeles to establish the same rushing balance that Indianapolis enjoyed. When the running game produces little yardage, the offense can become more predictable, particularly when the scoreboard encourages a team to pass frequently.
The comparison is striking: Indianapolis gained 120 rushing yards and scored three rushing touchdowns, while Los Angeles gained 54 yards without a rushing score.
That 66-yard difference in rushing production was a major part of the Colts’ overall advantage.
Receiving Leaders: Oronde Gadsden and Alec Pierce Stand Out
The receiving statistics reveal two very different patterns. Los Angeles generated more total receiving yardage, led by Oronde Gadsden and Keenan Allen. Indianapolis spread its production across several players and benefited from contributions by Alec Pierce, Tyler Warren, and Michael Pittman Jr.
Colts Receiving Statistics
| Receiver | Receptions | Targets | Receiving Yards | Yards per Catch | TDs | Longest Catch |
| Alec Pierce | 5 | 10 | 98 | 19.6 | 0 | 48 yards |
| Tyler Warren | 4 | 5 | 69 | 17.3 | 1 | 29 yards |
| Michael Pittman Jr. | 7 | 9 | 58 | 8.3 | 1 | 16 yards |
| Jonathan Taylor | 3 | 3 | 38 | 12.7 | 0 | 19 yards |
| Ameer Abdullah | 1 | 1 | 8 | 8.0 | 0 | 8 yards |
| Adonai Mitchell | 1 | 1 | 8 | 8.0 | 0 | 8 yards |
| Mo Alie-Cox | 1 | 2 | 6 | 6.0 | 0 | 6 yards |
| Anthony Gould | 1 | 1 | 3 | 3.0 | 0 | 3 yards |
| Team total | 23 | 32 | 288 | 12.5 | 2 | 48 yards |
Alec Pierce Provides the Deep-Threat Element
Pierce led Indianapolis in receiving yards with 98 on five catches. He averaged 19.6 yards per reception, and his longest catch covered 48 yards.
That average indicates that Pierce’s catches were particularly valuable in terms of gaining significant chunks of yardage. A receiver who can generate nearly 20 yards per catch gives an offense the ability to move into scoring range quickly.
Pierce did not record a receiving touchdown in the supplied statistics, but his role was still important. Receiving production is not limited to touchdowns. Long gains can create favorable field position, reduce the number of plays needed to reach scoring range, and make the defense account for threats beyond short passes.
Tyler Warren Converts His Opportunities
Warren caught four passes on five targets for 69 yards and one touchdown. His 17.3 yards per reception showed that he contributed meaningful downfield production rather than serving only as a short-range option.
His touchdown was especially valuable because it turned his receiving involvement into direct scoring output. Combined with Pierce’s big-play ability and Pittman’s steady catches, Warren helped give Jones several useful targets.
Michael Pittman Jr. Supplies Reliable Volume
Pittman caught seven passes on nine targets for 58 yards and one touchdown. His 8.3 yards per reception were lower than Pierce’s and Warren’s averages, but he recorded more catches than either receiver.
This highlights the value of different receiving roles. A team does not need every player to produce long gains. Shorter and intermediate receptions can help maintain possession, move the chains, and keep drives alive.
Chargers Receiving Statistics
| Receiver | Receptions | Targets | Receiving Yards | Yards per Catch | TDs | Longest Catch |
| Oronde Gadsden | 7 | 9 | 164 | 23.4 | 1 | 53 yards |
| Keenan Allen | 11 | 14 | 119 | 10.8 | 1 | 30 yards |
| Ladd McConkey | 9 | 15 | 67 | 7.4 | 0 | 15 yards |
| Quentin Johnston | 2 | 6 | 30 | 15.0 | 1 | 23 yards |
| Tre’ Harris | 2 | 2 | 23 | 11.5 | 0 | 14 yards |
| Kimani Vidal | 4 | 5 | 15 | 3.8 | 0 | 8 yards |
| Hassan Haskins | 2 | 2 | 2 | 1.0 | 0 | 2 yards |
| Will Dissly | 0 | 0 | 0 | N/A | 0 | N/A |
| Team total | 37 | 54 | 420 | 11.4 | 3 | 53 yards |
Oronde Gadsden Delivers the Biggest Receiving Performance
Gadsden led all listed receivers with 164 yards on seven catches. He averaged 23.4 yards per reception, caught one touchdown, and produced a longest reception of 53 yards.
His yardage alone exceeded the total receiving output of any Indianapolis receiver. He was the Chargers’ most productive individual receiving threat and showed how effective the Los Angeles passing attack could be when it found open space.
However, one player’s exceptional performance cannot guarantee a team victory. Gadsden’s production helped Los Angeles score, but the Chargers still struggled to match Indianapolis’s rushing output and protect possession.
Keenan Allen Adds Consistent Volume
Allen recorded 11 receptions on 14 targets for 119 yards and one touchdown. His 11 catches were the highest total among the listed receivers on either team.
His performance gave Herbert a dependable option throughout the passing game. Allen’s combination of volume and yardage was important, especially as Los Angeles attempted to recover from its early deficit.
Ladd McConkey Draws a High Number of Targets
McConkey caught nine passes for 67 yards on 15 targets. While his catch total was substantial, his 7.4 yards per reception were relatively modest compared with Gadsden’s and Allen’s figures.
The target count indicates that Herbert frequently looked in McConkey’s direction. However, targets do not automatically translate into productive completions. The difference between targets and catches can reflect several factors, including coverage, pass placement, and whether a throw was completed under pressure.
The available box score does not identify the precise reason for each incomplete pass, so it would be inaccurate to assign every missed target to one player or one cause.
Team Offensive Statistics Compared
The overall numbers explain why the Colts won despite giving up a much larger passing total.
| Team Statistic | Indianapolis Colts | Los Angeles Chargers |
| Final points | 38 | 24 |
| Passing yards | 288 | 420 |
| Rushing yards | 120 | 54 |
| Total offensive yards, passing plus rushing | 408 | 474 |
| Passing touchdowns | 2 | 3 |
| Rushing touchdowns | 3 | 0 |
| Interceptions thrown | 0 | 2 |
| Rushing attempts | 23 | 16 |
| Yards per rushing attempt | 5.2 | 3.4 |
| Receptions | 23 | 37 |
| Receiving yards per catch | 12.5 | 11.4 |
Total offensive yards here are calculated by adding the supplied passing and rushing totals. They should not be treated as a substitute for a complete official team-statistics report, which may include additional categories and accounting details.
Why More Total Yards Did Not Produce a Chargers Victory
Los Angeles accumulated 474 combined passing and rushing yards, compared with Indianapolis’s 408. The Chargers therefore gained 66 more yards by this simple calculation, yet they lost by 14 points.
There is no contradiction in that result. Total yardage does not account for every factor that determines a game’s outcome.
The Colts had several advantages:
- Rushing touchdowns: Indianapolis scored three times on the ground, while Los Angeles did not.
- Ball security: Jones threw no interceptions, while Herbert threw two.
- Offensive balance: Indianapolis combined 288 passing yards with 120 rushing yards.
- Early scoring: The Colts built a 23-3 lead by halftime.
- Defensive takeaways: Indianapolis recorded two interceptions.
The Chargers’ high passing total reflected both Herbert’s production and the volume of attempts required to chase the score. The Colts, by contrast, did not need to throw as frequently because Taylor helped sustain the offense and finish drives.
This is why analysts should examine efficiency, turnovers, scoring distribution, and game situation alongside total yards.
Defensive Player Stats: The Colts Make Their Opportunities Count
The defensive statistics help explain how Indianapolis protected its lead despite allowing Herbert to throw for 420 yards. The Colts recorded two interceptions, three sacks, four tackles for loss, six passes defended, and 15 quarterback hits.
Los Angeles recorded one sack, three tackles for loss, four passes defended, and five quarterback hits. Neither defense recorded a defensive touchdown.
Indianapolis Colts Defensive Statistics
| Defensive Player | Total Tackles | Solo Tackles | Sacks | Tackles for Loss | Passes Defended | QB Hits |
| Kenny Moore II | 8 | 4 | 0 | 0 | 1 | 0 |
| Cam Bynum | 8 | 3 | 0 | 0 | 0 | 0 |
| Nick Cross | 6 | 6 | 0 | 0 | 1 | 0 |
| Mekhi Blackmon | 6 | 5 | 0 | 0 | 1 | 0 |
| DeForest Buckner | 5 | 4 | 2 | 2 | 0 | 4 |
| Zaire Franklin | 5 | 2 | 0 | 0 | 1 | 2 |
| Team total | 73 | 43 | 3 | 4 | 6 | 15 |
The listed individual players are not the entire defensive roster. The team totals represent the broader defensive contribution, so the figures in the individual rows should not be expected to add up to every team category.
DeForest Buckner Creates Pressure
Buckner recorded two sacks, four quarterback hits, and two tackles for loss. Those numbers made him a significant part of the Colts’ defensive effort.
Pressure can influence a passing game even when it does not result in a sack. A quarterback who faces pressure may need to throw earlier than planned, change his intended target, or move away from the original pocket position.
Buckner’s four quarterback hits indicate repeated disruption, although the supplied statistics do not establish that every hit directly caused an interception or an incomplete pass.
His performance is particularly notable because the Chargers generated substantial passing yardage. The Colts did not completely shut down Herbert, but they created negative plays and recorded takeaways that helped offset his production.
Kenny Moore II and Cam Bynum Lead in Tackles
Moore and Bynum each recorded eight total tackles, the highest totals among the listed Indianapolis defenders.
Tackles are useful for understanding defensive involvement, particularly when a team is defending numerous passing attempts. However, tackle totals alone do not show whether every stop prevented a first down or limited a receiver to a short gain.
Their numbers should therefore be considered alongside the Colts’ interceptions, pass breakups, and pressure statistics. Together, these categories provide a more complete view of the defense’s contribution.
Nick Cross Contributes to the Turnover Battle
Cross recorded six total tackles, all of them solo tackles, and one pass defended. He also registered an interception according to the supplied interception statistics.
That interception was part of the Colts’ two-takeaway performance. Turnovers are especially valuable when an offense has built a lead because they can stop an opponent’s drive and provide the leading team with another opportunity to control the game.
Los Angeles Chargers Defensive Statistics
| Defensive Player | Total Tackles | Solo Tackles | Sacks | Tackles for Loss | Passes Defended | QB Hits |
| Derwin James Jr. | 7 | 3 | 0 | 0 | 0 | 2 |
| Tony Jefferson | 6 | 5 | 0 | 0 | 0 | 0 |
| Daiyan Henley | 2 | 0 | 0 | 0 | 0 | 0 |
| Team total | 58 | 32 | 1 | 3 | 4 | 5 |
Derwin James Jr. Tries to Disrupt the Colts
James recorded seven tackles and two quarterback hits. His involvement shows that the Chargers did generate some pressure and defensive activity.
However, the Chargers finished with only one sack and five quarterback hits as a team. Compared with Indianapolis’s three sacks and 15 quarterback hits, Los Angeles generated fewer recorded pressure events.
The difference does not prove that pressure alone decided the contest. Still, it supports the broader picture of a Colts defense that was more disruptive in several important categories.
The Chargers’ Defensive Challenge
The Chargers allowed 38 points and three rushing touchdowns. The challenge was not simply preventing passing yardage. They also needed to stop Indianapolis from turning its rushing opportunities into scores.
A defense facing a productive running back must balance its response to handoffs, quarterback play-action, and receivers operating downfield. If the defense commits too heavily to one part of the offense, another option may become available.
The supplied numbers show the result of that challenge, although they do not provide enough information to assign specific coverage errors or missed defensive assignments.
Interceptions and Turnovers: A Crucial Difference
Turnovers were one of the clearest statistical differences between the two teams.
| Turnover Statistic | Indianapolis Colts | Los Angeles Chargers |
| Interceptions recorded by defense | 2 | 0 |
| Interceptions thrown by quarterback | 0 | 2 |
| Interception return yards | 3 | 0 |
| Interception return touchdowns | 0 | 0 |
| Team fumbles recorded | 1 | 0 |
| Fumbles lost | 0 | 0 |
The Colts’ defensive interception totals included one interception credited to Grover Stewart, with three return yards, and another credited to Nick Cross. Neither interception resulted in a defensive touchdown.
The Colts also recorded one team fumble but did not lose possession on a fumble. Daniel Jones was credited with one fumble recovery in the supplied data. The Chargers had no fumbles recorded.
Why Turnover Margin Matters
An interception ends the opponent’s possession immediately. It can also affect field position and force an offense to start another drive from a less favorable position.
The Colts’ two interceptions were particularly damaging to Los Angeles because the Chargers were already chasing a substantial deficit. Every lost possession reduced the time and opportunities available to complete the comeback.
Herbert’s three touchdown passes show that he remained productive, but the two interceptions were a significant counterweight to that production.
Jones’s zero interceptions, meanwhile, allowed Indianapolis to maintain a cleaner passing profile. His approach was consistent with the needs of a team that could depend on its running game and did not need to take unnecessary risks to keep pace.
It is important not to treat every interception as equally damaging in every game. Field position, timing, and the score all matter. In this matchup, however, the combination of turnovers and the Colts’ early scoring advantage made the difference especially meaningful.
Special Teams Statistics
Special teams contributed to field position and scoring, although the main statistical story remained the Colts’ rushing attack and defensive takeaways.
Kicking Comparison
| Statistic | Michael Badgley, Colts | Cameron Dicker, Chargers |
| Field goals made | 1 | 1 |
| Field goals attempted | 1 | 1 |
| Field-goal percentage | 100% | 100% |
| Longest field goal | 36 yards | 43 yards |
| Extra points made | 3 | 3 |
| Extra points attempted | 4 | 3 |
| Total points | 6 | 6 |
Badgley made his only field-goal attempt, a 36-yard kick, and converted three of four extra-point attempts. Dicker also made his only field-goal attempt, from 43 yards, and converted all three of his extra-point attempts.
Both kickers scored six points in the supplied statistics. The difference in extra-point attempts reflects the scoring records, but the available data does not provide enough detail to attribute every missed or unrecorded scoring opportunity to a particular sequence without consulting the full play-by-play.
Kick Return Statistics
| Statistic | Indianapolis Colts | Los Angeles Chargers |
| Kick returns | 5 | 6 |
| Total return yards | 193 | 147 |
| Average return yards | 38.6 | 24.5 |
| Longest return | 81 yards | 30 yards |
| Return touchdowns | 0 | 0 |
Indianapolis had the stronger kick-return numbers. Its five returns produced 193 yards, averaging 38.6 yards per return. The Chargers recorded 147 yards on six returns, averaging 24.5 yards.
Ameer Abdullah led the Colts in kick-return yardage with 109 yards on two returns. His longest return covered 81 yards. Anthony Gould added 84 yards on three returns.
For Los Angeles, Nyheim Hines recorded 98 yards on four returns, while Derius Davis added 49 yards on two returns.
The Colts’ return average was boosted by Abdullah’s long return. That is an important statistical distinction: a high average can reflect one exceptional play as well as consistent gains across multiple returns. Even so, the 81-yard return demonstrates Indianapolis’s potential to gain substantial field position through its return unit.
Punting Statistics
| Statistic | Rigoberto Sanchez, Colts | JK Scott, Chargers |
| Punts | 2 | 1 |
| Total punt yards | 87 | 53 |
| Average punt distance | 43.5 yards | 53.0 yards |
| Touchbacks | 0 | 1 |
| Punts inside the 20 | 1 | 0 |
| Longest punt | 44 yards | 53 yards |
Sanchez averaged 43.5 yards on two punts and placed one punt inside the 20-yard line. Scott recorded one punt for 53 yards, including one touchback.
These figures describe the punters’ recorded output, but the small number of punts limits the conclusions that can be drawn from their averages. A punter’s overall impact depends on more than distance, including where the ball lands and the field position of the receiving team.
The Chargers’ single punt also fits the broader picture of a game in which Los Angeles frequently attempted to advance through its passing offense.
Three Major Lessons From the Game
The numbers offer several useful insights for readers who want to understand more than the final score.
1. Efficient Offense Can Beat Greater Passing Volume
Herbert threw for 420 yards, compared with Jones’s 288. Yet Indianapolis won by 14 points.
The Colts did not need to match every passing statistic because they gained 120 rushing yards and scored three rushing touchdowns. Jones also avoided interceptions, which helped preserve the value of his passing production.
This is a useful way to evaluate quarterback performances. Passing totals matter, but they should be considered alongside turnovers, rushing support, scoring efficiency, and the state of the game.
2. Rushing Touchdowns Have a Direct Impact on the Score
Taylor’s three rushing touchdowns were a defining part of Indianapolis’s victory. The Chargers did not record a rushing touchdown, leaving their scoring production dependent on other offensive plays.
The difference between three rushing touchdowns and none does not explain every point in the final score, but it highlights how Indianapolis converted its ground-game opportunities into direct results.
When evaluating running backs, yards per carry and total yardage help measure production. Touchdowns, however, explain how that production contributed to the scoreboard.
3. Defensive Takeaways Can Offset a Large Yardage Disadvantage
The Chargers generated more passing yards and more combined passing and rushing yards. Nevertheless, they threw two interceptions, while the Colts threw none.
This is a reminder that defenses do not need to eliminate every productive play to influence a game. A defense can allow substantial yardage but still create critical stops, sacks, and turnovers.
Indianapolis’s two interceptions and three sacks helped the team counter Los Angeles’s passing production. The overall result reflected the interaction between offensive efficiency and defensive disruption rather than one statistic alone.
How to Read Player Statistics From This Match
For readers comparing individual performances, a few simple steps can help prevent misleading conclusions.
Start with the score and game situation. A quarterback trailing by several scores may attempt far more passes than one whose team is ahead. That extra volume can increase yardage without necessarily indicating greater efficiency.
Compare production with opportunities. Jones attempted 34 passes and gained 288 yards, while Herbert attempted 55 and gained 420. Looking at yards per attempt gives useful context beyond the raw totals.
Separate volume from scoring impact. Gadsden led the Chargers in receiving yards, but Taylor led the Colts in rushing touchdowns. These performances served different purposes within their respective offenses.
Check negative plays. Interceptions, sacks, lost fumbles, and tackles for loss can change a possession’s value. In this matchup, Herbert’s two interceptions and three sacks were important parts of the statistical comparison.
Use more than one category. Tackles, passing yards, rushing averages, and touchdowns describe different parts of football performance. The strongest analysis considers them together rather than treating one number as the complete story.
This method is useful for comparing future NFL games, assessing player contributions, and understanding why a team can win without leading every statistical category.
Frequently Asked Questions
1. What was the final score of the Colts vs Chargers game on October 20, 2025?
The Indianapolis Colts defeated the Los Angeles Chargers 38-24. Indianapolis scored 23 points in the first half and added 15 in the third quarter to establish a lead that Los Angeles could not overcome.
2. How many passing yards did Daniel Jones record against the Chargers?
Daniel Jones completed 23 of 34 passes for 288 yards and two touchdowns. He threw no interceptions and finished with a 113.4 passer rating, according to the supplied game statistics.
3. How many passing yards and touchdowns did Justin Herbert have?
Justin Herbert completed 37 of 55 passes for 420 yards and three touchdowns. He also threw two interceptions and was sacked three times for a loss of 29 yards.
4. How many touchdowns did Jonathan Taylor score?
Jonathan Taylor scored three rushing touchdowns on 16 carries. He finished with 94 rushing yards, averaged 5.9 yards per carry, and recorded a longest run of 23 yards.
5. Who was the leading receiver in the game?
Oronde Gadsden led the listed receivers with 164 receiving yards on seven catches and one touchdown. Alec Pierce was Indianapolis’s leading receiver by yardage, recording 98 yards on five receptions.
6. Why did the Colts win despite having fewer passing yards?
Indianapolis combined efficient passing with a productive rushing attack, scoring three rushing touchdowns and avoiding interceptions. The Colts also recorded two interceptions on defense and built a substantial first-half lead. Those factors outweighed the Chargers’ larger passing total.
Conclusion
The colts vs chargers match player stats show how Indianapolis earned its 38-24 victory through balanced offense, effective rushing, and important defensive plays. Daniel Jones delivered two touchdown passes without an interception, while Jonathan Taylor scored three rushing touchdowns and averaged 5.9 yards per carry.
Justin Herbert’s 420 passing yards and three touchdowns demonstrated the potential of the Chargers’ passing attack, and Oronde Gadsden’s 164 receiving yards made him the game’s leading receiver. However, Herbert’s two interceptions, the Chargers’ limited rushing production, and Indianapolis’s strong first-half scoring left Los Angeles with too much ground to make up.
The decisive contrast was not simply the number of yards gained. Indianapolis converted its opportunities into points, protected the football through the passing game, and created defensive takeaways at important moments. Los Angeles moved the ball effectively through the air but could not overcome its mistakes and lack of rushing touchdowns.
For a complete assessment of an NFL matchup, individual statistics should always be considered alongside the score, scoring sequence, turnovers, and team performance. Together, these measures provide a clearer explanation of why the Colts won and why the Chargers’ impressive passing numbers were not enough.