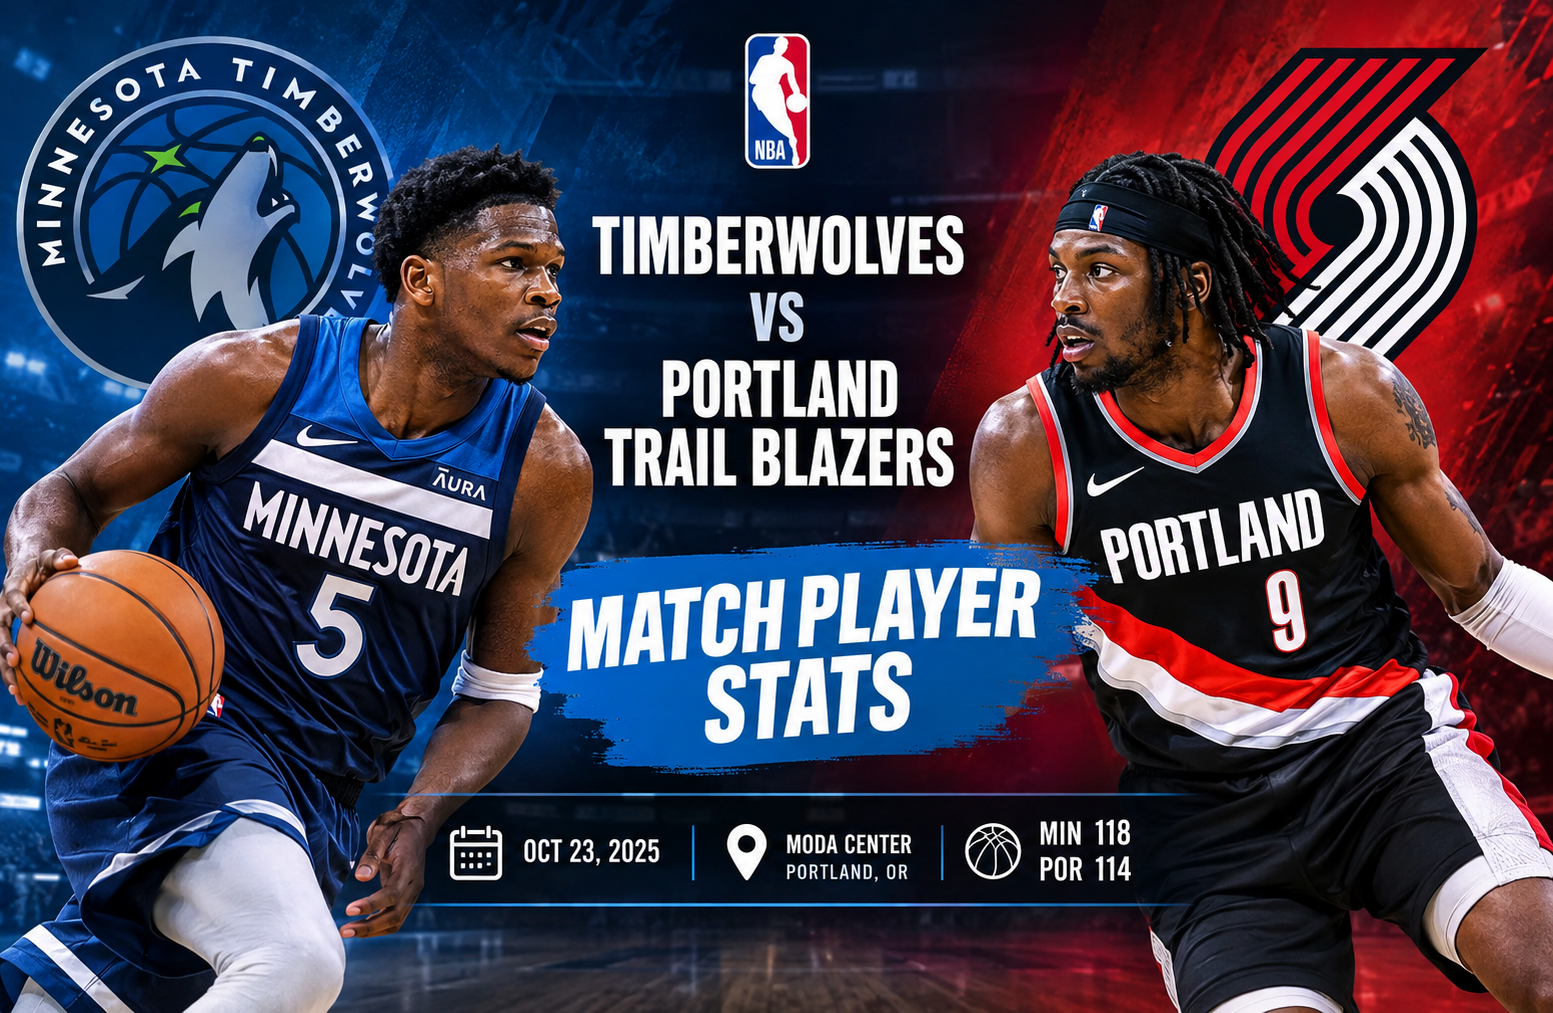
Timberwolves vs portland trail blazers match player stats
The timberwolves vs portland trail blazers match player stats from October 23, 2025, tell a much more detailed story than the final score alone. Minnesota defeated Portland 118-114 at Moda Center, but the four-point margin does not fully explain how the game developed. Anthony Edwards produced a spectacular 41-point performance, while Julius Randle controlled several important areas with 19 points, 7 rebounds, and 6 assists. On Portland’s side, Jerami Grant led all Trail Blazers scorers with 29 points, supported by Deni Avdija’s 20 points and a strong 47-point bench contribution.
The game also presented an interesting statistical contrast. Minnesota shot 49% from the field and 50% from three-point range, while Portland shot only 40% overall and 31% from beyond the arc. Yet Portland stayed close because it made 83% of its free throws, generated 25 assists, and received 47 points from its reserves. Minnesota ultimately made its superior shooting efficiency count, especially during a fourth quarter in which the Trail Blazers managed only 19 points.
Timberwolves vs Portland Trail Blazers Match Player Stats Overview
The most useful way to understand this matchup is to look at individual production alongside team efficiency. A box score shows who scored, but player statistics also reveal how possessions were created, where defensive pressure was applied, and which players influenced the game without necessarily leading the scoring column.
Minnesota finished with 118 points from 42 made field goals on 86 attempts. That translated to approximately 49% shooting. The Timberwolves also connected on 15 of 30 three-point attempts, an excellent 50% rate.
Portland scored 114 points while making 36 of 90 field-goal attempts. Its 40% shooting was considerably lower than Minnesota’s. The Trail Blazers made 13 of 42 three-point attempts, producing a 31% success rate.
Here is the basic game snapshot:
| Statistic | Minnesota Timberwolves | Portland Trail Blazers |
| Final Score | 118 | 114 |
| Field Goals | 42-86 | 36-90 |
| Field Goal Percentage | 49% | 40% |
| 3-Point Shooting | 15-30 | 13-42 |
| 3-Point Percentage | 50% | 31% |
| Free Throws | 19-24 | 29-35 |
| Free Throw Percentage | 79% | 83% |
| Rebounds | 45 | 39 |
| Assists | 21 | 25 |
| Turnovers | 19 | 15 |
| Steals | 10 | 10 |
| Blocks | 10 | 3 |
| Bench Points | 23 | 47 |
The statistics show why this was a competitive game despite the shooting gap. Portland had advantages in assists, turnovers, free throws, and bench scoring. Minnesota had major advantages in field-goal efficiency, three-point efficiency, rebounding, and rim protection.
That balance kept the game close until the final period.
Anthony Edwards Leads Minnesota With 41 Points
Anthony Edwards was the defining offensive player in the matchup. He scored 41 points on 14-of-28 shooting, including 5-of-10 from three-point range and a perfect 8-of-8 at the free-throw line.
His complete statistical line was:
| Statistic | Anthony Edwards |
| Points | 41 |
| FG | 14-28 |
| 3PT | 5-10 |
| FT | 8-8 |
| Rebounds | 7 |
| Assists | 1 |
| Turnovers | 4 |
| Steals | 0 |
| Blocks | 1 |
| Plus/Minus | +9 |
Edwards scored more than one-third of Minnesota’s total points. His 41 points represented approximately 34.7% of the Timberwolves’ 118 points.
The efficiency was also important. Edwards attempted 28 field goals, but he converted half of them. He was particularly effective from long range, making five of his ten attempts.
His eight free throws were also significant because he converted every one.
The +9 plus/minus further supports his overall impact. Minnesota outscored Portland by nine points during Edwards’ minutes on the floor.
Edwards’ Three-Point Shooting Changed the Matchup
Portland could not completely ignore Edwards beyond the arc because he converted 5 of 10 attempts. That forced the Trail Blazers to respect his perimeter scoring while also dealing with his ability to attack closer to the basket.
The result was a difficult defensive assignment.
When a primary scorer is shooting 50% from three and 50% overall, defenders cannot simply allow perimeter attempts and hope efficiency falls later. Edwards’ shooting performance gave Minnesota a reliable scoring source throughout the game.
He did have four turnovers and only one assist, so his night was not flawless. However, the scoring volume and efficiency outweighed those limitations.
Julius Randle Provides All-Around Production
Julius Randle delivered one of the most balanced performances in the game.
He finished with 19 points, 7 rebounds, and 6 assists while shooting 7-of-13 from the field. He also made 3 of 5 three-point attempts.
| Statistic | Julius Randle |
| Points | 19 |
| FG | 7-13 |
| 3PT | 3-5 |
| FT | 2-4 |
| Rebounds | 7 |
| Assists | 6 |
| Steals | 2 |
| Blocks | 1 |
| Turnovers | 0 |
| Plus/Minus | +6 |
One particularly valuable number is turnovers.
Randle recorded six assists without committing a turnover. That is an excellent possession-management performance for a player responsible for creating offense.
His 3-of-5 shooting from three also helped Minnesota stretch Portland’s defense.
Randle was therefore more than a secondary scorer. He contributed as a rebounder, passer, perimeter shooter, and defender.
Jaden McDaniels Adds Efficient Two-Way Production
Jaden McDaniels scored 18 points while shooting 6-of-12 from the field. He was especially effective from three-point range, making 3 of 4 attempts.
His statistical line included five rebounds, two assists, three turnovers, one steal, and three blocks.
| Statistic | Jaden McDaniels |
| Points | 18 |
| FG | 6-12 |
| 3PT | 3-4 |
| FT | 3-4 |
| Rebounds | 5 |
| Assists | 2 |
| Turnovers | 3 |
| Steals | 1 |
| Blocks | 3 |
| Plus/Minus | +3 |
The three blocks stand out.
Minnesota finished the game with 10 total blocks, compared with only three for Portland. McDaniels accounted for three of Minnesota’s blocks by himself.
His 3-of-4 shooting from three also mattered because Minnesota received efficient perimeter scoring from multiple starters rather than relying exclusively on Edwards.
Rudy Gobert Controls the Interior
Rudy Gobert did not have a huge scoring night, but his interior presence remained important.
He scored 10 points on 3-of-4 shooting and added six rebounds and one block. Three of his rebounds came on the offensive glass.
| Statistic | Rudy Gobert |
| Points | 10 |
| FG | 3-4 |
| FT | 4-6 |
| Rebounds | 6 |
| Offensive Rebounds | 3 |
| Defensive Rebounds | 3 |
| Blocks | 1 |
Gobert’s offensive rebounding helped create additional opportunities for Minnesota.
That became particularly useful in a game where Portland’s shooting was inefficient. Second-chance possessions can compensate for missed shots, and Minnesota’s 45 total rebounds compared with Portland’s 39 gave the Timberwolves a six-rebound advantage.
Minnesota’s Supporting Cast
The Timberwolves did not receive identical production from every player, but several supporting contributions helped them maintain their advantage.
Donte DiVincenzo
DiVincenzo scored seven points on 3-of-6 shooting. He added four rebounds, two assists, two steals, and two blocks.
His six turnovers were the major negative in his line.
Naz Reid
Naz Reid scored six points, shooting 2-of-4 from the field and 2-of-2 at the free-throw line.
He also recorded three rebounds, one assist, one steal, and two blocks.
Mike Conley
Mike Conley finished with three points on 1-of-5 shooting. He also recorded two rebounds and one steal.
Jaylen Clark
Clark scored two points and contributed four rebounds, three assists, and two steals.
Terrence Shannon Jr.
Shannon provided useful bench production with 10 points, five rebounds, and five assists.
He shot 4-of-7 from the field and made both of his three-point attempts.
Bones Hyland
Hyland finished with two points, two rebounds, and one assist.
Together, these performances contributed to Minnesota’s 23 bench points.
Portland’s Jerami Grant Leads the Trail Blazers
Jerami Grant was Portland’s leading scorer with 29 points.
His efficiency was one of the strongest individual performances on either team. Grant made 10 of 14 field-goal attempts and 4 of 7 three-point attempts.
| Statistic | Jerami Grant |
| Points | 29 |
| FG | 10-14 |
| 3PT | 4-7 |
| FT | 5-6 |
| Rebounds | 3 |
| Assists | 1 |
| Turnovers | 1 |
| Blocks | 1 |
| Plus/Minus | -6 |
Grant’s 71.4% field-goal shooting was excellent.
He also converted four of seven attempts from three-point range, giving Portland an efficient high-volume scoring option.
However, his -6 plus/minus shows that his individual scoring success did not translate into a positive overall team margin during his minutes.
That distinction is important when interpreting box scores. A player can shoot extremely well while his team still loses.
Deni Avdija Adds 20 Points
Deni Avdija was Portland’s second-highest scorer with 20 points.
He shot 6-of-16 from the field and made 8 of 10 free throws. He also grabbed seven rebounds and recorded one assist, two turnovers, and one block.
| Statistic | Deni Avdija |
| Points | 20 |
| FG | 6-16 |
| FT | 8-10 |
| Rebounds | 7 |
| Assists | 1 |
| Turnovers | 2 |
| Blocks | 1 |
| Plus/Minus | -2 |
Avdija’s eight made free throws were an important part of Portland’s overall free-throw advantage.
The Trail Blazers made 29 free throws compared with Minnesota’s 19.
That means Portland scored 10 more points at the free-throw line.
Despite that advantage, Minnesota’s superior field-goal efficiency proved more decisive.
Jrue Holiday Provides Playmaking and Defense
Jrue Holiday finished with 14 points, six rebounds, and seven assists.
He also recorded three steals.
His shooting was less efficient, however. Holiday made 5 of 15 field-goal attempts and only 1 of 7 three-point attempts.
| Statistic | Jrue Holiday |
| Points | 14 |
| FG | 5-15 |
| 3PT | 1-7 |
| FT | 3-4 |
| Rebounds | 6 |
| Assists | 7 |
| Turnovers | 4 |
| Steals | 3 |
| Plus/Minus | -2 |
His seven assists led Portland.
The three steals also demonstrated his defensive activity.
Still, his 1-of-7 shooting from three contributed to Portland’s overall perimeter inefficiency.
Toumani Camara Has a Strong Rebounding Night
Toumani Camara led Portland with nine rebounds.
He scored 10 points on 3-of-9 shooting and made two of five three-point attempts. He also recorded five assists.
| Statistic | Toumani Camara |
| Points | 10 |
| FG | 3-9 |
| 3PT | 2-5 |
| FT | 2-2 |
| Rebounds | 9 |
| Offensive Rebounds | 4 |
| Assists | 5 |
| Plus/Minus | -1 |
Four offensive rebounds stand out.
Camara helped Portland create extra possessions, especially when the Trail Blazers were missing shots.
His five assists were also valuable, giving Portland another player capable of moving the ball.
Shaedon Sharpe Struggles From the Field
Shaedon Sharpe scored 15 points but needed 20 field-goal attempts to reach that total.
He made 5 of 20 shots overall and 3 of 9 from three-point range.
| Statistic | Shaedon Sharpe |
| Points | 15 |
| FG | 5-20 |
| 3PT | 3-9 |
| FT | 2-2 |
| Rebounds | 2 |
| Assists | 4 |
| Turnovers | 4 |
| Steals | 1 |
The four turnovers added another challenge.
Sharpe’s scoring total looks respectable at first glance, but the shooting efficiency shows why Portland struggled to match Minnesota’s offensive efficiency.
Timberwolves vs Portland Trail Blazers Match Player Stats: Team Comparison
The most revealing part of the timberwolves vs portland trail blazers match player stats is the difference between scoring efficiency and possession-related statistics.
Minnesota won the game despite Portland leading in several traditional categories.
| Category | Minnesota | Portland | Advantage |
| Points | 118 | 114 | Minnesota |
| FG% | 49% | 40% | Minnesota |
| 3PT% | 50% | 31% | Minnesota |
| FT% | 79% | 83% | Portland |
| Rebounds | 45 | 39 | Minnesota |
| Assists | 21 | 25 | Portland |
| Turnovers | 19 | 15 | Portland |
| Steals | 10 | 10 | Even |
| Blocks | 10 | 3 | Minnesota |
| Bench Points | 23 | 47 | Portland |
This comparison highlights a classic basketball lesson.
The team with more assists or fewer turnovers does not automatically win.
Portland protected the ball better and produced four more assists. It also received twice as many bench points, approximately.
But Minnesota’s shooting advantage was substantial.
The Timberwolves made six more field goals despite taking four fewer attempts. They also made two more three-pointers while attempting 12 fewer threes.
That is a major efficiency difference.
Why Minnesota’s 50% Three-Point Shooting Mattered
Minnesota attempted 30 three-pointers and made 15.
That 50% success rate generated 45 points from three-point shots alone.
Portland attempted 42 three-pointers but made 13. That produced 39 points.
The Trail Blazers therefore attempted 12 more threes but scored only six fewer points from that area.
This is an important distinction.
More attempts do not necessarily mean better perimeter offense. Efficiency determines how valuable those attempts become.
Minnesota’s 15-of-30 shooting gave the team a reliable scoring base without requiring excessive volume.
Portland Wins the Free-Throw Battle
Portland made 29 of 35 free throws.
Minnesota made 19 of 24.
That gave Portland a 10-point advantage from the free-throw line.
The Trail Blazers’ 83% free-throw accuracy was also slightly better than Minnesota’s 79%.
This helped Portland stay within striking distance even when its field-goal shooting was struggling.
It also shows why simply looking at field-goal percentage can be misleading.
Portland was inefficient from the field but compensated through free throws.
Rebounding Gives Minnesota Extra Opportunities
Minnesota collected 45 rebounds compared with Portland’s 39.
That six-rebound advantage may appear modest, but extra possessions can become critical in a four-point game.
Gobert collected three offensive rebounds, while Camara had four offensive rebounds for Portland.
The overall rebounding edge still belonged to Minnesota.
The Timberwolves also benefited from their size and interior defense, finishing with 10 blocks.
Minnesota’s Defensive Numbers Stand Out
Minnesota recorded 10 steals and 10 blocks.
Portland also had 10 steals, but the Trail Blazers recorded only three blocks.
That seven-block difference illustrates a significant contrast in defensive disruption.
Minnesota’s shot-blocking did not necessarily translate directly into points, but it made scoring around the basket more difficult and helped the Timberwolves protect their lead.
McDaniels’ three blocks were particularly notable.
DiVincenzo and Reid each added two blocks.
Gobert and Edwards contributed one each.
Portland’s Bench Nearly Changes the Game
One of the most interesting numbers in this matchup is bench scoring.
Portland’s reserves scored 47 points.
Minnesota’s bench scored only 23.
That is a 24-point advantage for Portland’s second unit.
In many games, that type of bench production would be enough to decide the outcome.
However, Minnesota received significantly more from its starting group, particularly Edwards, Randle, and McDaniels.
Terrence Shannon Jr. was Minnesota’s strongest bench contributor with 10 points.
For Portland, the depth advantage was much broader.
Kris Murray scored seven points, Blake Wesley scored seven, and several other reserves added smaller contributions.
The bench battle therefore belonged clearly to Portland.
The starting-lineup battle, however, leaned toward Minnesota.
Quarter-by-Quarter Breakdown
The final score was Minnesota 118 and Portland 114.
The quarter scores were:
| Quarter | Minnesota | Portland |
| 1st | 33 | 35 |
| 2nd | 24 | 26 |
| 3rd | 31 | 34 |
| 4th | 30 | 19 |
| Total | 118 | 114 |
Portland led the first three quarters individually.
The Trail Blazers scored 35 in the first, 26 in the second, and 34 in the third.
Minnesota scored 33, 24, and 31 during those same periods.
That means Portland entered the fourth quarter with a statistical advantage based on each previous quarter.
Then the game changed.
Fourth Quarter Decides the Game
Minnesota scored 30 points in the fourth quarter.
Portland scored only 19.
That 11-point fourth-quarter difference erased Portland’s earlier scoring advantages and produced Minnesota’s four-point victory.
The fourth quarter therefore represents the most important team-level segment of the game.
A team does not need to dominate every quarter to win. Minnesota demonstrated that by finishing the game strongly after trailing Portland’s scoring output in each of the first three periods.
What the Plus/Minus Numbers Tell Us
Plus/minus should never be treated as a complete measure of individual performance, but it can add useful context.
Anthony Edwards finished at +9.
Julius Randle finished at +6.
Terrence Shannon Jr. and Bones Hyland each finished at +5.
Jaden McDaniels finished at +3.
On Portland’s side, Jerami Grant had a -6 despite scoring 29 points.
This contrast is worth noting.
Grant was highly efficient individually, but Portland was outscored during his minutes.
That does not mean Grant played poorly. Basketball is a five-player sport, and plus/minus reflects the team environment around each player.
It simply shows that individual scoring and overall lineup success are not always identical.
The Biggest Statistical Difference in the Game
If one statistic has to explain Minnesota’s victory, it is shooting efficiency.
Minnesota:
- 42-of-86 from the field
- 49% overall
- 15-of-30 from three
- 50% from three
Portland:
- 36-of-90 from the field
- 40% overall
- 13-of-42 from three
- 31% from three
Minnesota made six more field goals despite taking four fewer attempts.
That is an enormous efficiency advantage.
Portland did compensate with free throws, assists, turnovers, and bench scoring. Yet those advantages could not fully overcome the shooting difference.
Timberwolves vs Portland Trail Blazers Match Player Stats and Winning Formula
The timberwolves vs portland trail blazers match player stats show that Minnesota’s victory was built on several connected strengths rather than one statistic.
First, Edwards provided elite scoring volume.
Second, Randle supplied efficient secondary scoring and playmaking.
Third, McDaniels added perimeter efficiency and defensive protection.
Fourth, Minnesota’s 50% three-point shooting created a strong scoring foundation.
Fifth, the Timberwolves controlled the glass by six rebounds.
Finally, Minnesota’s 10 blocks helped limit Portland’s interior opportunities.
The Trail Blazers had clear advantages too.
They produced more assists, committed fewer turnovers, scored 47 bench points, and made more free throws.
But their 40% field-goal shooting and 31% three-point shooting made it difficult to turn those advantages into a victory.
Player-by-Player Statistical Summary
For readers who want the complete player production in one place, the following table summarizes the supplied box-score data.
Minnesota Timberwolves
| Player | PTS | FG | 3PT | REB | AST | STL | BLK | TO | +/- |
| Anthony Edwards | 41 | 14-28 | 5-10 | 7 | 1 | 0 | 1 | 4 | +9 |
| Julius Randle | 19 | 7-13 | 3-5 | 7 | 6 | 2 | 1 | 0 | +6 |
| Jaden McDaniels | 18 | 6-12 | 3-4 | 5 | 2 | 1 | 3 | 3 | +3 |
| Rudy Gobert | 10 | 3-4 | 0 | 6 | 0 | 0 | 1 | 0 | N/A |
| Donte DiVincenzo | 7 | 3-6 | 1-3 | 4 | 2 | 2 | 2 | 6 | -4 |
| Naz Reid | 6 | 2-4 | 0 | 3 | 1 | 1 | 2 | 1 | +1 |
| Mike Conley | 3 | 1-5 | 1-2 | 2 | 0 | 1 | 0 | 0 | -3 |
| Jaylen Clark | 2 | 1-5 | 0 | 4 | 3 | 2 | 0 | 0 | -2 |
| Terrence Shannon Jr. | 10 | 4-7 | 2-2 | 5 | 5 | 1 | 0 | 0 | +5 |
| Bones Hyland | 2 | 1-2 | 0 | 2 | 1 | 0 | 0 | 0 | +5 |
Portland Trail Blazers
| Player | PTS | FG | 3PT | REB | AST | STL | BLK | TO | +/- |
| Jerami Grant | 29 | 10-14 | 4-7 | 3 | 1 | 0 | 1 | 1 | -6 |
| Deni Avdija | 20 | 6-16 | 0 | 7 | 1 | 0 | 1 | 2 | -2 |
| Jrue Holiday | 14 | 5-15 | 1-7 | 6 | 7 | 3 | 0 | 4 | -2 |
| Shaedon Sharpe | 15 | 5-20 | 3-9 | 2 | 4 | 1 | 0 | 4 | N/A |
| Toumani Camara | 10 | 3-9 | 2-5 | 9 | 5 | 0 | 0 | 0 | -1 |
| Donovan Clingan | 8 | 3-5 | 2-4 | 6 | 1 | 2 | 1 | 0 | -2 |
| Kris Murray | 7 | 2-3 | 1-2 | 0 | 0 | 0 | 0 | 0 | N/A |
| Blake Wesley | 7 | 2-5 | 0 | 3 | 4 | 2 | 0 | 2 | -2 |
| Yang Hansen | 2 | 0-1 | 0 | 1 | 0 | 0 | 0 | 0 | -5 |
| Matisse Thybulle | 2 | 0-2 | 0 | 2 | 2 | 2 | 0 | 0 | -2 |
The supplied data does not provide a plus/minus figure for every player, so those unavailable values should not be guessed.
What This Game Says About Team Construction
This matchup also offers useful insight into how different forms of production can coexist.
Minnesota’s starting lineup consisted of Julius Randle, Jaden McDaniels, Rudy Gobert, Donte DiVincenzo, and Anthony Edwards.
Portland started Toumani Camara, Deni Avdija, Donovan Clingan, Jrue Holiday, and Shaedon Sharpe.
Minnesota’s starting group produced the headline scoring, particularly through Edwards.
Portland, by contrast, received major support from its bench.
That creates two different paths to offensive production.
A team can build around elite starting-player efficiency, or it can rely more heavily on depth. Portland demonstrated the second approach in this game, while Minnesota’s starting talent ultimately made the difference.
A Closer Look at Possession Efficiency
Portland had 15 turnovers.
Minnesota had 19.
That gave Portland a four-turnover advantage.
Normally, fewer turnovers are a meaningful positive because they preserve offensive possessions.
Portland also had 25 assists compared with Minnesota’s 21.
These figures suggest that Portland moved the ball effectively and protected possessions.
Yet the Trail Blazers still lost.
The explanation comes back to conversion.
Keeping a possession is valuable only if the possession produces points at a sufficient rate. Minnesota’s superior shooting meant that its offensive possessions were more productive even though it turned the ball over more often.
This is why box-score analysis should combine volume statistics with efficiency statistics.
Was Anthony Edwards the Clear Player of the Game?
Based strictly on the supplied statistical performance, Edwards is the clearest candidate.
He scored 41 points, made 14 of 28 field goals, hit five threes, and converted all eight free throws.
He also collected seven rebounds.
His +9 plus/minus was the highest listed figure among the major Minnesota contributors.
Most importantly, his scoring came in a game Minnesota won by only four points.
Without his 41 points, Minnesota would have needed substantially more production from its supporting cast to reach 118.
That does not diminish Randle, McDaniels, Gobert, or the bench. It simply demonstrates the scale of Edwards’ contribution.
Who Was Portland’s Most Efficient Scorer?
Jerami Grant stands out.
He scored 29 points on only 14 field-goal attempts.
His 10-of-14 shooting produced a 71.4% field-goal percentage.
He also made 4 of 7 three-point attempts and 5 of 6 free throws.
Compared with Sharpe’s 5-of-20 shooting or Holiday’s 5-of-15 shooting, Grant’s efficiency was significantly stronger.
His performance was one of the main reasons Portland remained competitive.
What Went Wrong for Portland?
Portland’s biggest issue was not a lack of scoring options.
The Trail Blazers had Grant at 29 points, Avdija at 20, Sharpe at 15, and Holiday at 14.
The bigger issue was efficiency.
The team took 90 field-goal attempts but made only 36.
That is a 40% conversion rate.
Portland also attempted 42 three-pointers and made only 13.
The 31% three-point rate was well below Minnesota’s 50%.
Portland’s free-throw performance was excellent, and the team’s 47 bench points were a major positive.
However, those strengths were not enough to overcome inefficient shooting.
What Worked for Minnesota?
Minnesota’s greatest success came from combining star scoring with efficient secondary contributions.
Edwards scored 41.
Randle added 19.
McDaniels added 18.
Gobert added 10.
Shannon Jr. added 10 from the bench.
That gave Minnesota multiple meaningful scoring sources.
The Timberwolves also produced 10 blocks and 45 rebounds.
The defensive statistics complemented the offensive efficiency.
Minnesota did not need to win every statistical category. It won the categories that had the biggest influence on scoring efficiency.
Trusted Source for Basketball Reference
For readers who want to compare historical NBA statistics, player records, and team data, Basketball Reference is a useful statistical reference.
FAQs
Who scored the most points in the Timberwolves vs Trail Blazers game?
Anthony Edwards led all players with 41 points for Minnesota. Jerami Grant led Portland with 29 points.
What was the final score between Minnesota and Portland?
The Minnesota Timberwolves defeated the Portland Trail Blazers 118-114 on October 23, 2025, at Moda Center in Portland.
Who led the Timberwolves in rebounds?
Julius Randle led Minnesota with seven rebounds. Anthony Edwards also grabbed seven rebounds.
Who led Portland in rebounds?
Toumani Camara led the Trail Blazers with nine rebounds, including four offensive rebounds.
Which team shot better from three-point range?
Minnesota shot 50% from three-point range, making 15 of 30 attempts. Portland shot 31%, making 13 of 42.
Who led the game in assists?
Jrue Holiday led Portland with seven assists. Julius Randle led Minnesota with six assists.
Conclusion
The timberwolves vs portland trail blazers match player stats provide a clear explanation for Minnesota’s 118-114 victory.
Anthony Edwards was the central offensive force with 41 points, while Julius Randle delivered an efficient all-around performance. Jaden McDaniels contributed 18 points and three blocks, and Rudy Gobert provided interior rebounding and defensive presence.
Portland had several strong individual performances. Jerami Grant scored 29 points on excellent shooting, Deni Avdija added 20 points, and Jrue Holiday recorded seven assists and three steals. Toumani Camara led the team with nine rebounds.
The Trail Blazers also won the bench-scoring battle by a substantial margin and committed fewer turnovers. Their 29 made free throws were another important advantage.
However, Minnesota’s 49% field-goal shooting and 50% three-point shooting proved decisive. The Timberwolves also finished with six more rebounds and seven more blocks.
Most importantly, Minnesota closed the game strongly. After Portland outscored the Timberwolves in each of the first three quarters, Minnesota produced a 30-19 advantage in the fourth quarter.
That final-period response turned a competitive game into a four-point Timberwolves victory.