Chicago Bears vs Baltimore Ravens Match Player Stats
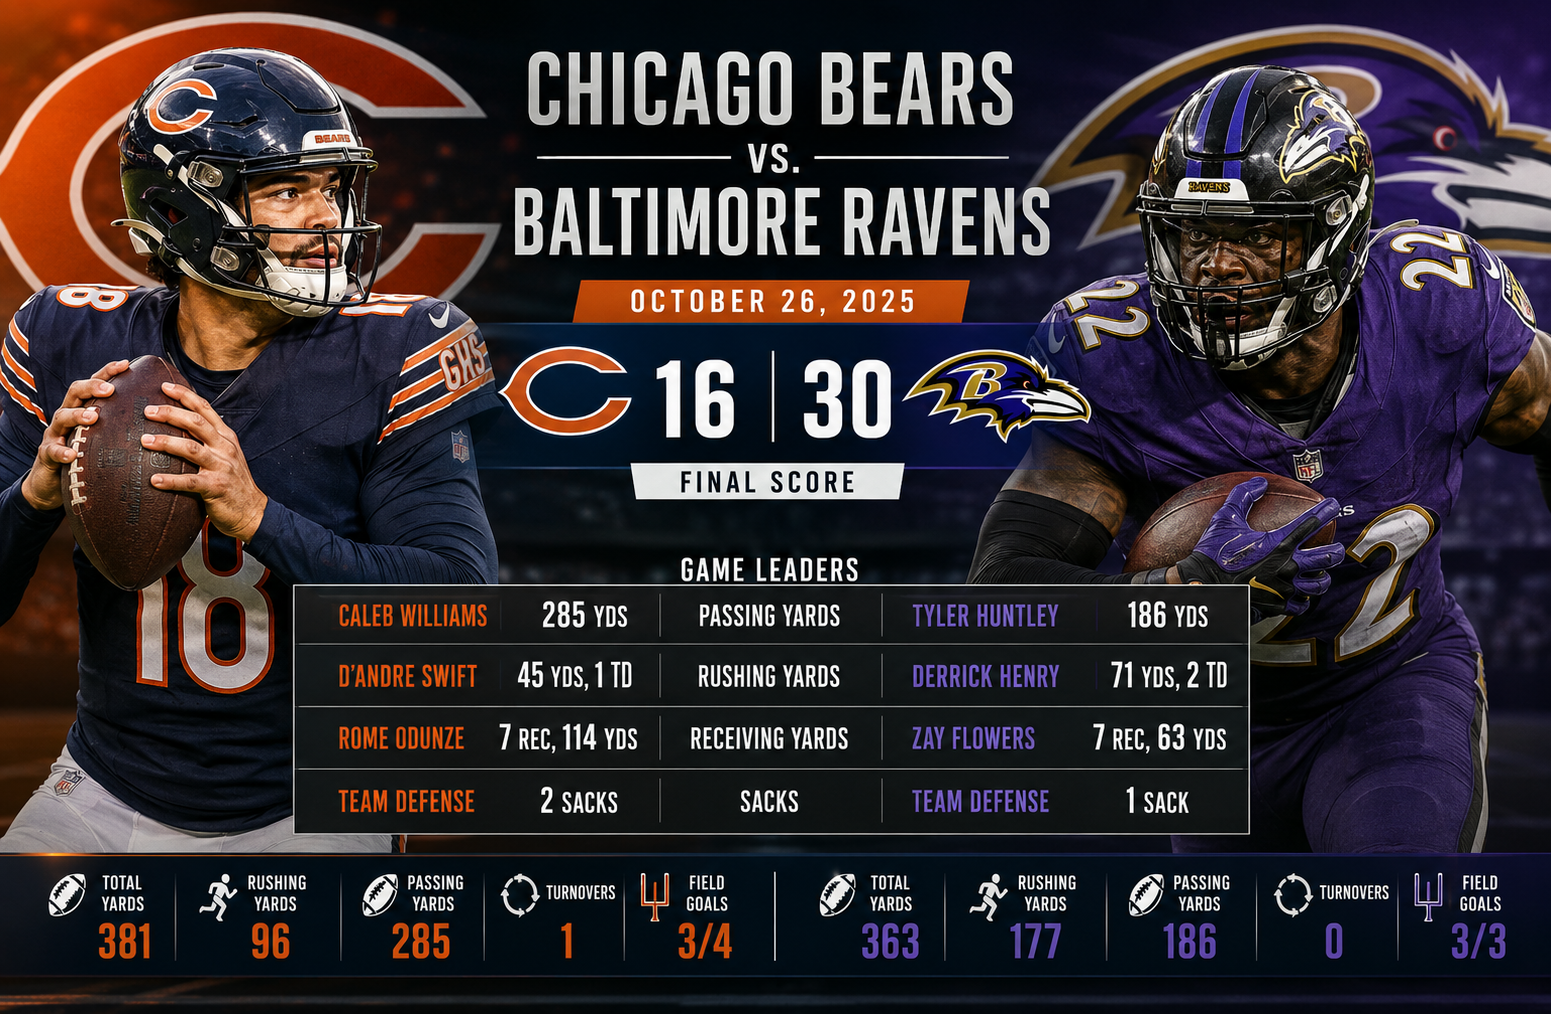
Chicago Bears vs Baltimore Ravens Match Player Stats from the October 26, 2025 Week 8 meeting tell a much clearer story than the 30-16 final score alone. Baltimore defeated Chicago at M&T Bank Stadium, but the game was competitive early before the Ravens separated themselves through rushing efficiency, red-zone execution, and timely defensive plays.
The Ravens entered the game at 1-5 and improved to 2-5 with the victory, while the Bears fell to 4-3. Baltimore was without Lamar Jackson, so Tyler Huntley stepped into the starting quarterback role. Huntley completed 17 of 22 passes for 186 yards, one touchdown, and no interceptions while adding 53 rushing yards on eight attempts. Chicago’s Caleb Williams completed 25 of 38 passes for 285 yards, but he was intercepted once and did not throw a touchdown.
The most important statistical difference was on the ground. Baltimore rushed for 177 yards on 35 attempts, averaging 5.1 yards per carry. Chicago managed 96 rushing yards on 23 attempts, averaging 4.2 yards per carry. That 81-yard difference in rushing production helped Baltimore control the game and create better scoring opportunities.
Chicago Bears vs Baltimore Ravens Match Player Stats: Game Overview
The final score was Baltimore Ravens 30, Chicago Bears 16. The Ravens scored in every quarter except the first, while Chicago built an early 6-0 advantage through two Cairo Santos field goals.
Baltimore responded in the second quarter with a Derrick Henry rushing touchdown and a Tyler Loop field goal. The Ravens entered halftime ahead 10-6. They then added six points in the third quarter before producing 14 points in the fourth quarter to put the game beyond Chicago’s reach.
According to the official NFL game information, the matchup took place at M&T Bank Stadium in Baltimore during Week 8 of the 2025 regular season. Official NFL game center
Final Score
| Team | Q1 | Q2 | Q3 | Q4 | Final |
| Chicago Bears | 6 | 0 | 0 | 10 | 16 |
| Baltimore Ravens | 0 | 10 | 6 | 14 | 30 |
The quarter-by-quarter scoring shows an important pattern. Chicago started better, but Baltimore steadily took control rather than winning through one explosive stretch.
That matters when evaluating individual performances. A player can post impressive yardage totals in a losing effort, while another player can produce fewer overall yards but make the plays that influence possession, field position, and scoring.
Caleb Williams Passing Performance
Caleb Williams had one of the more productive passing performances for Chicago in terms of raw yardage. He completed 25 of 38 attempts for 285 yards.
His statistical line was:
| Statistic | Caleb Williams |
| Completions | 25 |
| Attempts | 38 |
| Completion Rate | 65.8% |
| Passing Yards | 285 |
| Yards per Attempt | 7.5 |
| Touchdowns | 0 |
| Interceptions | 1 |
| Sacks | 1 |
| Sack Yards Lost | 9 |
| QBR | 67.0 |
| Passer Rating | 77.2 |
The 285 passing yards are significant because Chicago moved the ball through the air efficiently enough to keep the offense competitive. Williams averaged 7.5 yards per attempt, which indicates that Chicago was not simply relying on short completions.
However, passing yards do not tell the entire story.
Williams did not throw a touchdown, and Baltimore intercepted him once. That turnover became especially important because Baltimore’s offense was able to convert its possessions into points more consistently.
His 67.0 QBR and 77.2 passer rating also show the difference between producing yardage and producing a complete quarterback performance. The Williams generated opportunities, but Baltimore ultimately did more with its possessions.
Williams’ Rushing Contribution
Williams also contributed 24 rushing yards on only three attempts.
| Player | Carries | Rushing Yards | Average | Long | TD |
| Caleb Williams | 3 | 24 | 8.0 | 22 | 0 |
The 22-yard longest run was particularly notable because it accounted for most of his rushing production.
This type of quarterback rushing can create additional stress for a defense. Even with only three attempts, Williams averaged 8.0 yards per carry, showing that his mobility remained an important part of Chicago’s offensive profile.
Tyler Huntley Controls the Game for Baltimore
Tyler Huntley’s performance was one of the defining factors in the result.
With Lamar Jackson unavailable, Huntley completed 17 of 22 passes for 186 yards and one touchdown without throwing an interception.
| Statistic | Tyler Huntley |
| Completions | 17 |
| Attempts | 22 |
| Completion Rate | 77.3% |
| Passing Yards | 186 |
| Yards per Attempt | 8.5 |
| Touchdowns | 1 |
| Interceptions | 0 |
| Sacks | 2 |
| Sack Yards Lost | 8 |
| QBR | 88.3 |
| Passer Rating | 116.9 |
The most striking number is his 116.9 passer rating.
Huntley did not need to throw 35 or 40 passes. Baltimore’s rushing attack carried a substantial share of the workload, allowing the quarterback to operate within a balanced offensive structure.
His 77.3% completion rate was also considerably higher than Williams’ 65.8%.
The comparison becomes even more interesting when yards per attempt are considered. Huntley averaged 8.5 yards per attempt, while Williams averaged 7.5.
That means Huntley was more efficient despite throwing fewer passes.
Why Huntley’s Performance Matters
Huntley’s biggest contribution was not simply the passing touchdown. It was his ability to avoid the costly mistake.
He threw no interceptions while Williams threw one. Huntley also added 53 rushing yards, including a 29-yard run.
That combination gave Baltimore another dimension.
The Ravens did not need Huntley to imitate Jackson statistically. Instead, they needed him to make enough throws, use his legs when necessary, and protect the football.
He did that effectively.
Derrick Henry Leads Baltimore’s Rushing Attack
Derrick Henry was the centerpiece of Baltimore’s ground game.
He carried the ball 21 times for 71 yards and scored two touchdowns.
| Statistic | Derrick Henry |
| Carries | 21 |
| Rushing Yards | 71 |
| Average | 3.4 |
| Long | 10 |
| Touchdowns | 2 |
Henry’s 3.4 yards per carry was not spectacular, but the touchdown total tells a different story.
His two rushing touchdowns gave Baltimore points at critical moments and demonstrated why raw rushing efficiency should always be considered alongside situational production.
Henry scored on a two-yard run in the second quarter, helping Baltimore turn a 6-0 deficit into a 7-6 lead.
That was an important momentum shift.
He later added another rushing touchdown as Baltimore extended its advantage.
Henry’s Real Impact
A common mistake when reviewing running back statistics is judging a player only by average yards per carry.
Henry’s workload of 21 carries was important in itself.
Baltimore used him repeatedly, allowing the offense to stay balanced while reducing pressure on Huntley. Even when Henry did not produce large gains, his carries helped keep Chicago’s defense committed to the run.
That opened opportunities for Huntley and Baltimore’s other playmakers.
Keaton Mitchell Provides Explosive Rushing
Keaton Mitchell had a smaller workload than Henry but produced a much higher average.
He carried four times for 43 yards, averaging 10.8 yards per attempt. His longest run covered 25 yards.
| Player | Carries | Yards | Average | Long |
| Keaton Mitchell | 4 | 43 | 10.8 | 25 |
Mitchell’s production illustrates why a good rushing offense needs more than one type of runner.
Henry provided volume and short-yardage power.
Mitchell provided explosiveness.
That combination makes defensive preparation difficult. A defense can prepare for Henry’s physical style, but if another back consistently creates space in the open field, the offense becomes much harder to contain.
Baltimore’s Quarterback Run Game
Huntley added 53 rushing yards on eight attempts.
That gave him a 6.6-yard average and a 29-yard long run.
| Player | Carries | Yards | Average | Long | TD |
| Tyler Huntley | 8 | 53 | 6.6 | 29 | 0 |
This was one of the most important statistical advantages for Baltimore.
The Ravens finished with 177 rushing yards as a team. Henry accounted for 71, Huntley added 53, and Mitchell contributed 43.
Those three players alone accounted for 167 rushing yards.
That means the Ravens were not simply relying on one runner. They generated production from multiple positions and multiple rushing styles.
Chicago’s Rushing Production
Chicago finished with 96 rushing yards on 23 attempts.
The team’s leading rusher was D’Andre Swift.
| Player | Carries | Yards | Average | Long | TD |
| D’Andre Swift | 11 | 45 | 4.1 | 13 | 1 |
| Caleb Williams | 3 | 24 | 8.0 | 22 | 0 |
| Kyle Monangai | 7 | 24 | 3.4 | 15 | 0 |
| DJ Moore | 2 | 3 | 1.5 | 3 | 0 |
| Team | 23 | 96 | 4.2 | 22 | 1 |
Swift scored Chicago’s only rushing touchdown.
His 45 yards on 11 carries gave him a respectable 4.1-yard average, but Chicago did not receive the same level of explosive production from its supporting rushing options that Baltimore generated.
That difference became more important as the game progressed.
Rome Odunze Has a Big Receiving Day
Rome Odunze was Chicago’s leading receiver.
He finished with seven receptions for 114 yards on 10 targets.
| Statistic | Rome Odunze |
| Receptions | 7 |
| Targets | 10 |
| Receiving Yards | 114 |
| Average | 16.3 |
| Long | 27 |
| Touchdowns | 0 |
Odunze’s 114 yards represented 40% of Chicago’s 285 passing yards.
That is a significant share of the passing production.
His 16.3 yards per reception also indicates that Chicago was able to create meaningful gains when the ball went his way.
The challenge for Chicago was that this production did not translate into enough touchdowns.
Odunze had 114 receiving yards but no touchdown. Baltimore, meanwhile, generated a passing touchdown and two rushing touchdowns.
That difference between yardage and scoring efficiency is central to understanding the final result.
DJ Moore Adds Explosive Receiving Plays
DJ Moore finished with four receptions for 73 yards on seven targets.
His 42-yard reception was the longest catch of the game for Chicago.
| Statistic | DJ Moore |
| Receptions | 4 |
| Targets | 7 |
| Receiving Yards | 73 |
| Average | 18.3 |
| Long | 42 |
| Touchdowns | 0 |
Moore averaged 18.3 yards per reception.
That is an excellent figure, especially considering that his longest reception went for 42 yards.
But once again, Chicago’s receiving production did not result in a passing touchdown.
This is one of the clearest lessons from the matchup. The Bears could produce explosive passing plays without consistently finishing drives with touchdowns.
Chicago’s Other Receivers
Colston Loveland recorded three receptions for 38 yards on five targets.
Olamide Zaccheaus caught seven passes for 33 yards on seven targets. His production was based more on volume than explosiveness.
D’Andre Swift added two receptions for 26 yards.
Devin Duvernay caught one pass for two yards, while Luther Burden III recorded one reception for minus one yard.
The complete receiving totals were:
| Player | Rec | Targets | Yards | Avg | Long | TD |
| Rome Odunze | 7 | 10 | 114 | 16.3 | 27 | 0 |
| DJ Moore | 4 | 7 | 73 | 18.3 | 42 | 0 |
| Colston Loveland | 3 | 5 | 38 | 12.7 | 18 | 0 |
| Olamide Zaccheaus | 7 | 7 | 33 | 4.7 | 6 | 0 |
| D’Andre Swift | 2 | 2 | 26 | 13.0 | 25 | 0 |
| Devin Duvernay | 1 | 3 | 2 | 2.0 | 2 | 0 |
| Luther Burden III | 1 | 1 | -1 | -1.0 | -1 | 0 |
| Team | 25 | 35 | 285 | 11.4 | 42 | 0 |
The numbers show that Chicago’s passing attack was productive but incomplete.
Two receivers surpassed 70 yards, yet nobody scored a receiving touchdown.
Zay Flowers Leads Baltimore Receivers
Zay Flowers was Baltimore’s leading receiver with seven receptions for 63 yards on nine targets.
| Statistic | Zay Flowers |
| Receptions | 7 |
| Targets | 9 |
| Receiving Yards | 63 |
| Average | 9.0 |
| Long | 20 |
| Touchdowns | 0 |
Flowers did not produce a huge yardage total, but he was heavily involved.
Nine targets represented a large portion of Huntley’s passing attempts, and seven receptions gave Baltimore a reliable underneath and intermediate option.
Rashod Bateman Provides a Big-Play Element
Rashod Bateman caught two passes for 51 yards on four targets.
His average of 25.5 yards per reception was Baltimore’s most impressive receiving efficiency among players with multiple catches.
His longest reception covered 36 yards.
| Player | Rec | Targets | Yards | Average | Long |
| Rashod Bateman | 2 | 4 | 51 | 25.5 | 36 |
Bateman’s role was different from Flowers’ role.
Flowers provided volume.
Bateman provided chunk-yardage potential.
That balance gave Baltimore different ways to move the ball.
Mark Andrews and Baltimore’s Tight Ends
Mark Andrews finished with three receptions for 34 yards on three targets.
Charlie Kolar had one reception for 10 yards and scored Baltimore’s receiving touchdown.
Isaiah Likely added two catches for eight yards.
DeAndre Hopkins caught one pass for 14 yards, while Tylan Wallace recorded one reception for six yards.
Baltimore’s receiving totals were:
| Player | Rec | Targets | Yards | Average | Long | TD |
| Zay Flowers | 7 | 9 | 63 | 9.0 | 20 | 0 |
| Rashod Bateman | 2 | 4 | 51 | 25.5 | 36 | 0 |
| Mark Andrews | 3 | 3 | 34 | 11.3 | 24 | 0 |
| DeAndre Hopkins | 1 | 1 | 14 | 14.0 | 14 | 0 |
| Charlie Kolar | 1 | 1 | 10 | 10.0 | 10 | 1 |
| Isaiah Likely | 2 | 2 | 8 | 4.0 | 5 | 0 |
| Tylan Wallace | 1 | 1 | 6 | 6.0 | 6 | 0 |
| Derrick Henry | 0 | 1 | 0 | 0.0 | 0 | 0 |
| Team | 17 | 22 | 186 | 10.9 | 36 | 1 |
Baltimore completed only 17 passes compared with Chicago’s 25.
Yet the Ravens scored 30 points.
That is a useful reminder that completion totals and passing yards must be interpreted within the larger offensive structure.
The Rushing Difference Decided the Matchup
The simplest statistical explanation for Baltimore’s victory is the rushing comparison.
| Category | Chicago | Baltimore |
| Rushing Attempts | 23 | 35 |
| Rushing Yards | 96 | 177 |
| Yards per Carry | 4.2 | 5.1 |
| Rushing TDs | 1 | 2 |
| Long Run | 22 | 29 |
Baltimore had:
- 12 more rushing attempts
- 81 more rushing yards
- 0.9 more yards per carry
- One additional rushing touchdown
- A longer longest run
The 81-yard rushing advantage is particularly important.
It allowed Baltimore to maintain offensive balance even without Lamar Jackson.
The Ravens were able to run the ball 35 times while Chicago ran it 23 times. That additional volume also helped Baltimore keep Huntley’s passing workload manageable.
Passing Efficiency Versus Passing Volume
The passing comparison tells a different story.
| Category | Chicago | Baltimore |
| Completions | 25 | 17 |
| Attempts | 38 | 22 |
| Passing Yards | 285 | 186 |
| Yards per Attempt | 7.5 | 8.5 |
| Passing TDs | 0 | 1 |
| Interceptions | 1 | 0 |
| Sacks | 1 | 2 |
| Passer Rating | 77.2 | 116.9 |
| QBR | 67.0 | 88.3 |
Chicago threw for 99 more yards.
Baltimore had the better passing efficiency.
That distinction matters.
Chicago needed more passing volume because its rushing attack was less productive. Baltimore could rely on the running game and ask Huntley to make selective throws.
The result was fewer attempts but a higher yards-per-attempt average, a better passer rating, and no interception.
Defensive Performance
Chicago’s defense recorded 74 total tackles, including 41 solo tackles.
The Bears recorded two sacks, four tackles for loss, one pass defended, and three quarterback hits.
Baltimore recorded 68 total tackles, with 44 solo tackles.
The Ravens had one sack, six tackles for loss, two passes defended, and four quarterback hits.
| Defensive Category | Chicago | Baltimore |
| Total Tackles | 74 | 68 |
| Solo Tackles | 41 | 44 |
| Sacks | 2 | 1 |
| Tackles for Loss | 4 | 6 |
| Passes Defended | 1 | 2 |
| QB Hits | 3 | 4 |
| Interceptions | 0 | 1 |
The biggest difference was the interception.
Nate Wiggins recorded Baltimore’s only interception, returning it nine yards.
Chicago did not intercept Huntley.
This created an important turnover advantage for Baltimore.
Baltimore’s Defense Creates the Key Turnover
Nate Wiggins’ interception is one of the most important individual defensive statistics from the game.
Chicago had enough offensive production to score more than 16 points, but Baltimore’s defense created the game’s only interception.
A turnover can change the expected value of a possession dramatically because it ends one team’s drive and gives the opponent an opportunity.
The Ravens did not need multiple takeaways.
One interception was enough to contribute to a broader advantage in possession efficiency.
Special Teams Comparison
Special teams also played a meaningful role.
Cairo Santos converted three of four field-goal attempts for Chicago. His longest successful kick was 47 yards. He also made his only extra-point attempt, finishing with 10 points.
Tyler Loop was perfect for Baltimore, making all three field-goal attempts and all three extra-point attempts.
| Kicking Category | Cairo Santos | Tyler Loop |
| Field Goals | 3/4 | 3/3 |
| Field Goal Percentage | 75% | 100% |
| Long | 47 | 42 |
| Extra Points | 1/1 | 3/3 |
| Points | 10 | 12 |
Santos’ three field goals helped Chicago stay in the game early.
However, Chicago’s inability to convert those scoring opportunities into touchdowns became increasingly important.
Baltimore’s scoring profile was more balanced, combining field goals with rushing and receiving touchdowns.
Kick Return Comparison
Chicago recorded six kick returns for 157 yards, averaging 26.2 yards per return.
Devin Duvernay had three returns for 96 yards, averaging 32.0 yards with a long of 49.
Josh Blackwell added three returns for 61 yards.
Baltimore recorded five kick returns for 154 yards, averaging 30.8 yards per return.
Rasheen Ali returned three kicks for 88 yards, while Keaton Mitchell had two returns for 66 yards.
| Team | Returns | Yards | Average | Long |
| Chicago | 6 | 157 | 26.2 | 49 |
| Baltimore | 5 | 154 | 30.8 | 39 |
Chicago had slightly more total return yards, but Baltimore had the better average.
Neither team had a punt return touchdown.
Duvernay recorded Chicago’s only punt return, gaining eight yards.
Punting Comparison
Tory Taylor punted twice for Chicago for a total of 108 yards, averaging 54.0 yards per punt. His longest punt traveled 65 yards.
Jordan Stout punted twice for Baltimore for 95 yards, averaging 47.5 yards. His longest punt went 55 yards.
| Punting Category | Chicago | Baltimore |
| Punts | 2 | 2 |
| Total Yards | 108 | 95 |
| Average | 54.0 | 47.5 |
| Long | 65 | 55 |
| Touchbacks | 1 | 0 |
| Inside 20 | 0 | 2 |
Taylor had the stronger raw punting average, but Stout placed both of his punts inside the 20-yard line.
That difference illustrates why average distance alone is not enough to judge punting performance.
What the Score Does Not Tell You
The 30-16 score can make the game appear one-sided.
The player statistics provide more context.
Chicago passed for 285 yards compared with Baltimore’s 186. The Bears also had 25 completions compared with Baltimore’s 17.
Those numbers might suggest that Chicago controlled the passing game.
But Baltimore dominated the ground game and produced better passing efficiency.
The Ravens also avoided an interception while creating one.
Most importantly, Baltimore scored three touchdowns compared with Chicago’s one.
That is why the final score favored Baltimore despite Chicago producing more passing yards.
The Importance of Red-Zone Execution
Chicago’s offensive statistics demonstrate a familiar football problem: moving the ball is not the same as finishing drives.
Williams threw for 285 yards and the Bears had 25 completions.
Odunze and Moore combined for 187 receiving yards.
Yet Chicago did not record a passing touchdown.
The Bears’ only touchdown came on Swift’s rushing attempt.
Baltimore, on the other hand, scored two rushing touchdowns and one receiving touchdown.
This gave the Ravens a much better touchdown profile.
For a team analyzing offensive performance, this is one of the first areas to examine after looking at yardage totals.
Three Players Who Changed the Game
Tyler Huntley
Huntley deserves the strongest consideration for Baltimore’s offensive player of the game.
He completed 17 of 22 passes, threw one touchdown without an interception, and added 53 rushing yards.
His 116.9 passer rating was the highest quarterback rating in the matchup.
He did not overwhelm Chicago with passing volume. Instead, he was efficient within Baltimore’s run-heavy approach.
Derrick Henry
Henry carried 21 times and scored two touchdowns.
His 71 rushing yards were not his most explosive statistical performance, but his workload and scoring impact were important.
He gave Baltimore a dependable option in short-yardage and goal-line situations.
Rome Odunze
Odunze was Chicago’s standout receiving performer.
His seven receptions, 114 yards, 10 targets, and 16.3-yard average showed that he was a major part of the Bears’ passing offense.
The problem was that his production did not lead to a receiving touchdown.
A Closer Look at Chicago’s Offensive Efficiency
Chicago’s 285 passing yards on 38 attempts equate to 7.5 yards per attempt.
That is a respectable passing figure.
The Bears also produced 96 rushing yards, giving them a combined 381 yards through passing and rushing based on the provided team totals.
The issue was converting production into points.
Chicago scored 16 points despite moving the ball effectively through the air.
The offense therefore had a yardage-to-points efficiency problem.
Baltimore’s offense produced 363 combined passing and rushing yards, slightly fewer total yards than Chicago, yet scored 30 points.
This is perhaps the most important statistical lesson from the game.
More total yardage does not automatically mean more points.
A Closer Look at Baltimore’s Offensive Efficiency
Baltimore’s 177 rushing yards created the foundation for the entire offense.
The Ravens averaged 5.1 yards per carry and ran the ball 35 times.
That allowed Huntley to throw only 22 passes.
His 8.5 yards per attempt meant Baltimore still generated meaningful passing production without relying on high volume.
The Ravens also scored three touchdowns.
That combination of rushing volume, passing efficiency, and touchdown production explains how Baltimore scored 30 points without producing 300 passing yards.
Turnovers and Mistakes
The turnover statistics were simple.
Chicago recorded no interceptions.
Baltimore recorded one interception through Nate Wiggins.
Both teams had one fumble listed, but neither team’s listed fumble was lost in the provided statistics.
The takeaway is therefore straightforward.
Baltimore won the interception battle 1-0.
In a game decided by 14 points, one takeaway can have meaningful influence, particularly when combined with superior rushing production and touchdown efficiency.
Chicago Bears vs Baltimore Ravens Match Player Stats: Key Takeaways
The most useful way to interpret the player numbers is to connect individual performances to team strategy.
First, Caleb Williams produced significant passing yardage, but Baltimore limited the scoring impact of that production.
Second, Tyler Huntley delivered an efficient performance while avoiding turnovers.
Third, Derrick Henry provided the volume and goal-line production Baltimore needed.
Fourth, Keaton Mitchell supplied explosive runs that raised the Ravens’ overall rushing efficiency.
Fifth, Rome Odunze was excellent statistically, but Chicago needed more scoring production from its passing game.
Sixth, Baltimore’s defense created the only interception of the game.
Finally, Baltimore’s kicking was perfect on field goals, while Chicago missed one field-goal attempt.
These details collectively explain the 30-16 result better than any single box-score category.
Player Stat Summary
Chicago Bears
| Player | Key Production |
| Caleb Williams | 25/38, 285 pass yards, 0 TD, 1 INT |
| D’Andre Swift | 11 carries, 45 yards, 1 TD |
| Kyle Monangai | 7 carries, 24 yards |
| Rome Odunze | 7 receptions, 114 yards |
| DJ Moore | 4 receptions, 73 yards |
| Colston Loveland | 3 receptions, 38 yards |
| Olamide Zaccheaus | 7 receptions, 33 yards |
| Cairo Santos | 3/4 FG, 1/1 XP |
| Devin Duvernay | 3 kick returns, 96 yards |
| Tory Taylor | 2 punts, 54.0-yard average |
Baltimore Ravens
| Player | Key Production |
| Tyler Huntley | 17/22, 186 pass yards, 1 TD, 0 INT |
| Derrick Henry | 21 carries, 71 yards, 2 TDs |
| Keaton Mitchell | 4 carries, 43 yards |
| Zay Flowers | 7 receptions, 63 yards |
| Rashod Bateman | 2 receptions, 51 yards |
| Mark Andrews | 3 receptions, 34 yards |
| Charlie Kolar | 1 reception, 10 yards, 1 TD |
| Tyler Loop | 3/3 FG, 3/3 XP |
| Nate Wiggins | 1 interception, 9 return yards |
| Jordan Stout | 2 punts, 47.5-yard average |
What This Matchup Reveals About Team Building
The game provides a useful example of why offensive balance remains valuable in the NFL.
Chicago had a productive passing attack, but Baltimore was able to establish a stronger rushing identity.
The Ravens did not need Huntley to throw 38 times.
Instead, the team distributed rushing attempts among Henry, Huntley, Mitchell, Flowers, and Justice Hill.
That variety created different problems for the Bears defense.
Chicago’s offensive approach was more dependent on Williams’ arm and the receiving corps.
When the Bears were able to connect with Odunze and Moore, they gained significant yardage.
But when drives reached scoring situations, Baltimore’s defense and Chicago’s lack of passing touchdowns limited the payoff.
This is the difference between offensive volume and offensive efficiency.
How to Read These Stats Correctly
Anyone comparing player performances from this game should avoid focusing on one number.
A better process is:
- Start with passing efficiency rather than passing yards alone.
- Compare rushing volume and yards per carry.
- Look at touchdowns and turnovers.
- Examine individual target volume.
- Consider explosive plays.
- Review kicking accuracy.
- Connect individual statistics to the final score.
Using this approach, Huntley’s performance becomes more impressive than his 186 passing yards initially suggest.
Williams’ 285 passing yards remain impressive, but his lack of passing touchdowns and one interception become more important when evaluating the complete performance.
Similarly, Henry’s 3.4-yard rushing average looks ordinary until his 21 carries and two touchdowns are considered.
Final Assessment
Chicago produced several strong individual statistical performances.
Caleb Williams passed for 285 yards. Rome Odunze exceeded 100 receiving yards. DJ Moore averaged 18.3 yards per reception. D’Andre Swift scored a rushing touchdown. Chicago’s special teams also produced strong kick-return numbers.
But Baltimore’s statistical profile was better aligned with winning football in this particular matchup.
The Ravens ran for 177 yards, averaged 5.1 yards per carry, scored two rushing touchdowns, received an efficient performance from Huntley, and won the interception battle.
Huntley’s 17-of-22 passing line was efficient rather than spectacular. Henry’s 71 rushing yards came with two touchdowns. Mitchell added explosive runs. Flowers provided reliable volume. Wiggins created the game’s only interception.
Chicago’s statistics show that the Bears were capable of moving the football.
Baltimore’s statistics show why moving the football was not enough.
The decisive difference was what each team did with its opportunities.
The Ravens turned their rushing production and efficient quarterback play into 30 points. Chicago produced more passing yards but finished with only 16 points.
For anyone studying Chicago Bears vs Baltimore Ravens Match Player Stats, that is the central lesson from the October 26, 2025 matchup: efficiency, scoring execution, rushing balance, and turnover creation mattered more than raw passing volume.
FAQs
Who won the Bears vs Ravens game on October 26, 2025?
The Baltimore Ravens defeated the Chicago Bears 30-16 at M&T Bank Stadium.
How many passing yards did Caleb Williams have?
Caleb Williams completed 25 of 38 passes for 285 yards. He threw no touchdowns and one interception.
How did Tyler Huntley perform against the Bears?
Tyler Huntley completed 17 of 22 passes for 186 yards and one touchdown without an interception. He also rushed for 53 yards on eight attempts.
How many rushing yards did Derrick Henry have?
Derrick Henry rushed 21 times for 71 yards and scored two touchdowns.
Who was Chicago’s leading receiver?
Rome Odunze led Chicago with seven receptions for 114 yards on 10 targets.
Which team had more rushing yards?
Baltimore had significantly more rushing production. The Ravens gained 177 yards on 35 attempts, while Chicago gained 96 yards on 23 attempts.
Conclusion
Chicago and Baltimore produced very different statistical profiles in their Week 8 meeting.
The Bears generated 285 passing yards and received strong performances from Caleb Williams, Rome Odunze, and DJ Moore. However, they struggled to turn that passing production into touchdowns.
Baltimore took a more balanced approach. The Ravens rushed for 177 yards, used Derrick Henry heavily, received explosive contributions from Keaton Mitchell and Tyler Huntley, and protected the football through the air.
Huntley’s efficiency was especially important. He completed 77.3% of his passes, averaged 8.5 yards per attempt, threw one touchdown, and avoided an interception.
The Ravens also made the key defensive play when Nate Wiggins intercepted Williams.
Ultimately, the 30-16 result was shaped by Baltimore’s ability to combine rushing volume, quarterback efficiency, touchdown production, and timely defense. Chicago’s individual yardage leaders had strong numbers, but Baltimore consistently produced the types of plays that directly affected the scoreboard.
For readers reviewing the complete player statistics, the matchup is a strong example of why football analysis should go beyond total yards. Efficiency, turnovers, scoring plays, rushing balance, and situational production provide the context needed to understand how the Ravens won despite Chicago producing more passing yards.


2 Comments