Oklahoma City Thunder vs Pacers Match Player Stats
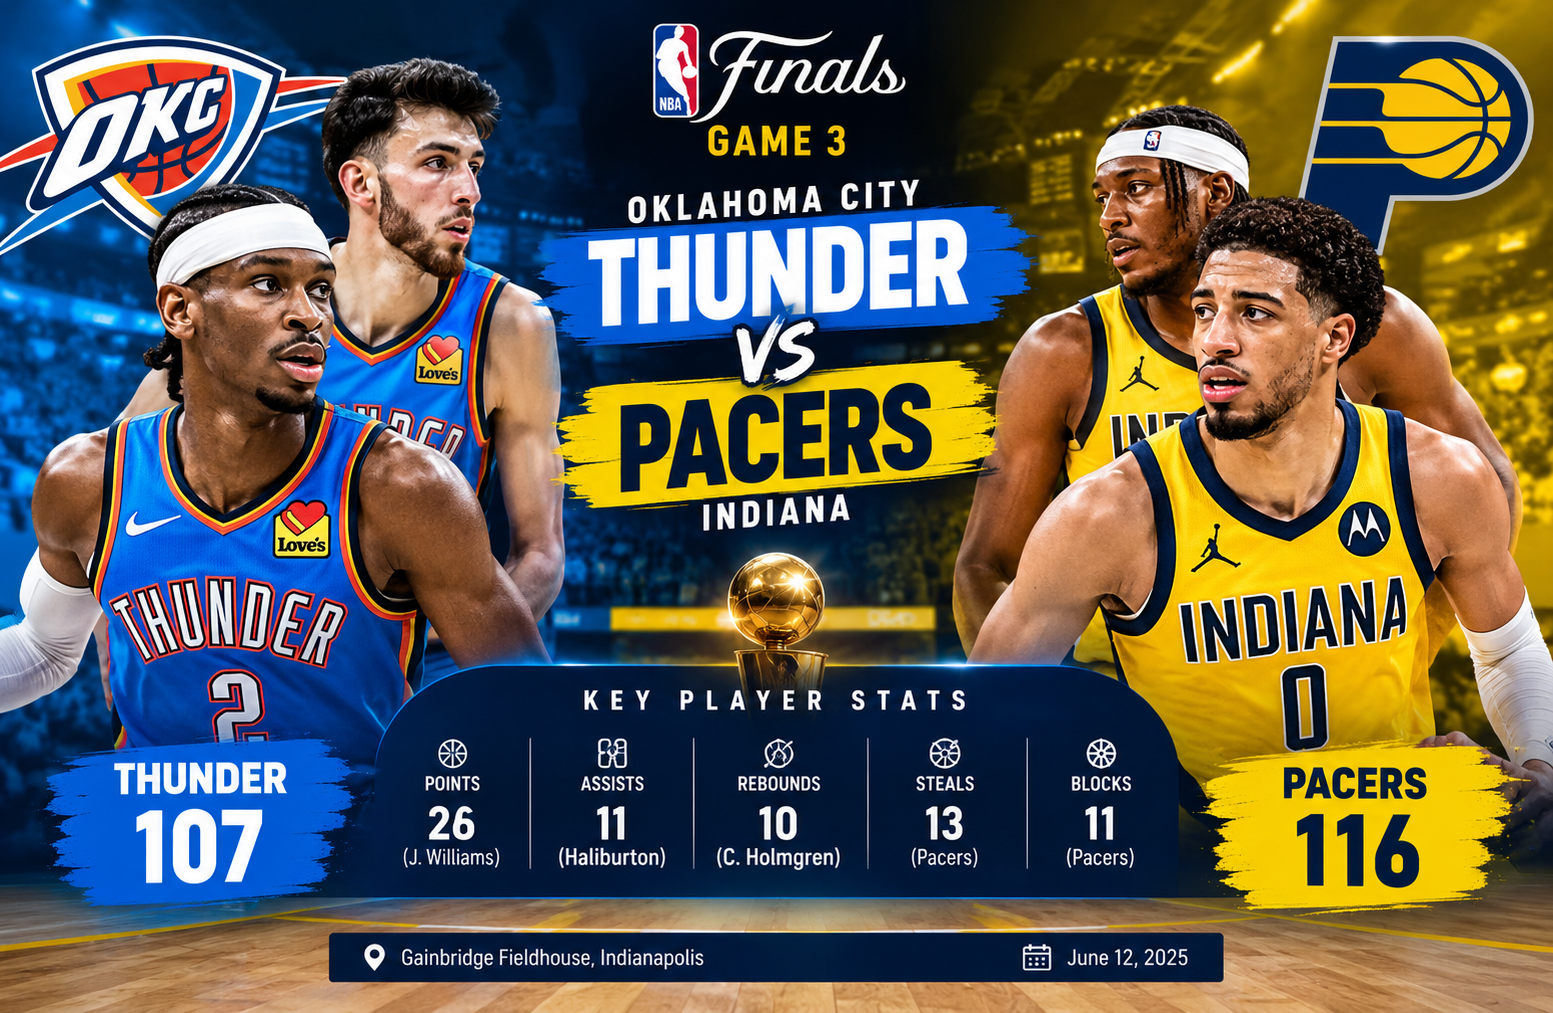
The oklahoma city thunder vs pacers match player stats from Game 3 of the 2025 NBA Finals tell a much deeper story than the final 116-107 score. Indiana defeated Oklahoma City at Gainbridge Fieldhouse and moved ahead 2-1 in the championship series, but the most important details were found in the fourth-quarter defense, bench production, ball security, and the way Indiana responded after trailing late.
This game was a strong example of how individual statistics can explain a team’s performance better than the final score alone. Jalen Williams led Oklahoma City with 26 points, Shai Gilgeous-Alexander added 24, and Chet Holmgren finished as the Thunder’s leading rebounder with 10. For Indiana, Bennedict Mathurin produced a game-high 27 points, while Tyrese Haliburton delivered 22 points, 11 assists, and 9 rebounds.
Oklahoma City Thunder vs Pacers Match Player Stats: Game Overview
Game 3 was played at Gainbridge Fieldhouse in Indianapolis during the 2025 NBA Finals. Indiana entered the contest with a 1-1 series record after splitting the opening two games in Oklahoma City. The Pacers then protected home court with a 116-107 victory.
The result gave Indiana a 2-1 advantage in the best-of-seven NBA Finals. The official NBA game record lists the attendance at 17,274, while the game featured 15 ties and nine lead changes.
Game Summary
| Category | Oklahoma City Thunder | Indiana Pacers |
| Final Score | 107 | 116 |
| Q1 | 32 | 24 |
| Q2 | 28 | 40 |
| Q3 | 29 | 20 |
| Q4 | 18 | 32 |
| Field Goals | 37-79 | 44-85 |
| Field Goal % | 47% | 52% |
| 3-Pointers | 10-22 | 9-27 |
| 3PT % | 45% | 33% |
| Free Throws | 23-30 | 19-22 |
| FT % | 77% | 86% |
| Rebounds | 42 | 36 |
| Assists | 16 | 24 |
| Turnovers | 17 | 13 |
| Steals | 6 | 13 |
| Blocks | 4 | 11 |
The numbers show why this was not simply a case of Indiana shooting better. Oklahoma City actually had the better three-point percentage and collected more rebounds. The Pacers won because they generated more total field goals, moved the ball more effectively, protected possession better, and created major defensive events through steals and blocks.
Oklahoma City Thunder Player Stats
The Thunder received strong scoring performances from their two leading offensive players, but the overall offensive structure became less effective when Indiana increased its defensive pressure.
Jalen Williams
Jalen Williams was Oklahoma City’s leading scorer with 26 points.
He shot 9-of-18 from the field for 50%, made 1-of-2 three-point attempts, and converted 7-of-11 free throws. He also recorded 6 rebounds, 3 assists and 1 steal. His official plus-minus was -9.
Williams was particularly important because Oklahoma City needed secondary scoring alongside Gilgeous-Alexander. His ability to attack the basket and create offense helped the Thunder stay competitive deep into the game.
His production was also important in the third quarter. Oklahoma City closed that period strongly and entered the fourth with a five-point lead after a late Williams three-pointer.
That sequence demonstrates why his 26 points should not be evaluated only as a scoring total. His production came during several stretches when Oklahoma City needed someone other than its primary star to create an advantage.
Shai Gilgeous-Alexander
Shai Gilgeous-Alexander finished with 24 points, making him Oklahoma City’s second-leading scorer.
His scoring total was respectable, but Indiana’s defensive approach was significant because Gilgeous-Alexander had scored 72 points across the first two games of the Finals. The Pacers held him to 24 points in Game 3 and kept his efficiency below the level he had established earlier in the series.
This was one of the biggest tactical differences in the game.
When Gilgeous-Alexander was able to control the pace and consistently reach his preferred scoring areas, Oklahoma City could build pressure on Indiana’s defense. Indiana instead used more aggressive perimeter defense and disrupted the flow of his offense.
That did not completely stop him. A 24-point performance is still productive in a Finals game. But Indiana succeeded in making every possession more difficult, particularly when the game entered its decisive stages.
Chet Holmgren
Chet Holmgren was the Thunder’s leading rebounder with 10 rebounds.
He also made an immediate offensive impact, scoring 13 points in the opening portion of the game before Indiana adjusted.
Holmgren’s performance illustrates the changing nature of the game. Oklahoma City had success when its size and athleticism created pressure around the basket. Indiana later countered with Myles Turner and Obi Toppin, particularly during the fourth quarter.
Holmgren’s 10 rebounds were important because Oklahoma City finished with a 42-36 advantage on the glass. Yet that rebounding edge did not translate into victory.
This is a useful reminder when analyzing oklahoma city thunder vs pacers match player stats. A statistical advantage in one category does not automatically determine the winner.
Luguentz Dort
Luguentz Dort scored 12 points and shot 4-of-8 from the field. He was particularly effective from three-point range, making 4-of-5 attempts for 80%. He also collected 4 rebounds.
Dort’s outside shooting gave Oklahoma City valuable spacing.
His four made three-pointers represented a major portion of the Thunder’s perimeter production. However, Indiana’s defensive activity eventually reduced Oklahoma City’s ability to generate clean possessions late in the game.
Cason Wallace and the Thunder’s Supporting Cast
Cason Wallace started alongside Holmgren, Gilgeous-Alexander, Dort and Williams. The Thunder also relied on players such as Isaiah Hartenstein, Alex Caruso, Aaron Wiggins and other reserves.
The bigger issue was not simply whether individual role players contributed. It was the overall difference in supporting production and defensive disruption.
Oklahoma City finished with:
- 16 assists
- 17 turnovers
- 6 steals
- 4 blocks
Indiana finished with:
- 24 assists
- 13 turnovers
- 13 steals
- 11 blocks
That statistical gap became increasingly important as the game progressed.
Indiana Pacers Player Stats
Indiana’s individual production was led by Mathurin and Haliburton, but the most impressive part of the Pacers’ performance was the combination of star production and bench impact.
Bennedict Mathurin
Bennedict Mathurin was the game’s leading scorer with 27 points.
What made his performance especially important was that he produced those 27 points off the bench in only 22 minutes. He became the youngest player to score at least 25 points off the bench in an NBA Finals game since bench starting designations were fully recorded in 1970-71.
Mathurin’s aggression changed the game.
Indiana needed an offensive spark after Oklahoma City opened strongly. Mathurin provided exactly that type of production. His scoring helped the Pacers erase an early deficit and establish momentum during the second quarter.
He was not simply collecting points during low-pressure minutes. His offense arrived in a Finals game where the Pacers were attempting to regain control of a series against the league’s top regular-season team.
Tyrese Haliburton
Tyrese Haliburton produced one of the most complete statistical performances of the game.
He finished with:
- 22 points
- 11 assists
- 9 rebounds
That left him one rebound short of a triple-double.
His 11 assists were particularly important because Indiana finished with 24 assists as a team.
Haliburton’s value in this game was not limited to scoring. He helped Indiana control possessions, create opportunities for teammates and respond to Oklahoma City’s defensive pressure.
The Pacers also benefited from his ability to contribute across multiple statistical categories. A player producing 22 points, 11 assists and 9 rebounds can influence the game without needing to dominate the scoring column.
Myles Turner
Myles Turner played an especially important role defensively.
He finished with five blocks, including three blocks during the final 5:25 of the fourth quarter. Those late defensive plays were a major reason Oklahoma City’s offense struggled to finish the game.
Turner’s defensive performance was more valuable than his raw scoring output.
Late in the fourth quarter, Indiana repeatedly made the Thunder reconsider attacks around the basket. Turner provided rim protection while the Pacers’ perimeter defenders created pressure farther from the hoop.
That combination created a difficult environment for Oklahoma City.
T.J. McConnell
T.J. McConnell was another major difference-maker.
He finished with:
- 10 points
- 5 assists
- 5 steals
His five steals were particularly important because Indiana finished with 13 steals overall. No player had previously come off the bench and recorded 10 points, 5 assists and 5 steals in an NBA Finals game since those statistics began being tracked.
McConnell’s influence went beyond his scoring.
His activity increased Indiana’s defensive pressure and helped create extra possessions. In a game decided by margins, those extra possessions were highly valuable.
Pascal Siakam and the Starting Unit
Pascal Siakam, Myles Turner, Andrew Nembhard, Aaron Nesmith and Tyrese Haliburton were Indiana’s starters.
The starting lineup provided the foundation, but Game 3 demonstrated why Indiana could not be evaluated only through its starters.
The Pacers received exceptional contributions from the bench, particularly Mathurin and McConnell. That depth allowed Indiana to maintain pressure when Oklahoma City’s stars were trying to regain control.
Quarter-by-Quarter Breakdown
The quarter scores provide one of the clearest explanations for the final result.
First Quarter: Thunder 32, Pacers 24
Oklahoma City started aggressively.
The Thunder scored 32 points in the opening period while holding Indiana to 24. That eight-point advantage gave Oklahoma City early control.
Holmgren was especially productive early, while Oklahoma City’s primary scorers established an offensive rhythm.
At this point, the game looked more favorable to the Thunder.
But Indiana did not allow the early deficit to define the contest.
Second Quarter: Pacers 40, Thunder 28
The second quarter completely changed the game’s direction.
Indiana scored 40 points, compared with 28 for Oklahoma City.
Mathurin and McConnell helped ignite the comeback from the bench. Mathurin scored 14 points in the second quarter, while McConnell added 6 points and 4 assists during Indiana’s rally.
The Pacers entered halftime with a four-point lead.
This was arguably the first major turning point because Indiana transformed an eight-point first-quarter deficit into a four-point halftime advantage.
Third Quarter: Thunder 29, Pacers 20
Oklahoma City responded after halftime.
The Thunder outscored Indiana 29-20 and recovered the lead. A late 13-5 run put Oklahoma City ahead by five entering the fourth quarter, with Williams hitting a three-pointer with 0.8 seconds remaining in the period.
This was an important response because the Thunder did not allow Indiana’s second-quarter surge to become permanent.
Instead, the game entered the final period with Oklahoma City in position to win.
Fourth Quarter: Pacers 32, Thunder 18
The fourth quarter decided everything.
Indiana outscored Oklahoma City 32-18.
The Pacers tightened their defense and forced Oklahoma City into difficult possessions. Indiana held the Thunder to only nine points over a seven-and-a-half-minute stretch late in the fourth quarter and allowed just one field goal over the final 5:57.
That is the clearest explanation for the final score.
Oklahoma City had a five-point lead entering the fourth, yet Indiana won the final period by 14 points.
The Biggest Statistical Difference: Turnovers and Defensive Plays
One of the most useful ways to interpret oklahoma city thunder vs pacers match player stats is to focus on possession quality.
Oklahoma City committed 17 turnovers.
Indiana committed 13.
That four-turnover difference was meaningful, but the defensive activity was even more dramatic.
Indiana recorded:
- 13 steals
- 11 blocks
Oklahoma City recorded:
- 6 steals
- 4 blocks
The Pacers therefore produced 24 combined steals and blocks, compared with 10 for the Thunder.
Those numbers reflect more than individual defensive talent. They show how aggressively Indiana contested possessions.
A team can survive poor three-point shooting when it compensates through defense, transition opportunities and extra possessions.
That is largely what happened here.
Shooting Efficiency Was Not the Whole Story
At first glance, the shooting numbers may seem surprising.
Oklahoma City shot 45% from three-point range, while Indiana shot only 33%.
The Thunder also shot 47% overall compared with Indiana’s 52%.
So why did Indiana win?
Because shooting percentage was only one part of the equation.
The Pacers made seven more field goals:
Indiana: 44
Oklahoma City: 37
Indiana also generated more assists and committed fewer turnovers.
The Pacers’ 24 assists compared with 16 for Oklahoma City showed an eight-assist advantage. Their 13 turnovers compared with 17 for the Thunder created another important possession edge.
This is why a box-score analysis should never focus only on points and shooting percentages.
Free Throws and Physical Pressure
The Thunder attempted 30 free throws and made 23.
Indiana attempted 22 and made 19.
Oklahoma City therefore had more free-throw opportunities, but the Pacers were more accurate.
Indiana converted 86% of its free throws, while Oklahoma City converted 77%.
The difference was not enormous by itself, but it contributed to Indiana’s ability to protect its late-game advantage.
In a close Finals contest, free throws can become especially important because every empty possession becomes more costly.
Rebounding Advantage for Oklahoma City
One of the clearest areas where Oklahoma City performed better was rebounding.
The Thunder collected 42 rebounds compared with Indiana’s 36.
Chet Holmgren led Oklahoma City with 10 rebounds.
This advantage helped Oklahoma City create second-chance opportunities and control the glass.
However, Indiana compensated through defensive events and ball pressure.
This is an important lesson from the game. Winning the rebounding battle does not guarantee control of the game if the opponent is generating turnovers, blocks and transition chances.
Assists Showed Indiana’s Offensive Balance
The Pacers recorded 24 assists compared with only 16 for the Thunder.
That eight-assist difference is significant.
Haliburton alone contributed 11 assists, meaning he accounted for almost half of Indiana’s total assists.
This suggests that Indiana’s offense was not dependent on one player creating his own shot every possession.
The Pacers were able to move the ball and create opportunities for multiple contributors.
That was particularly valuable when Oklahoma City’s defense focused attention on Haliburton.
Why the Bench Mattered So Much
The bench was one of the defining stories of the game.
Mathurin scored 27 points.
McConnell added 10 points, 5 assists and 5 steals.
The significance is straightforward.
When a Finals game becomes a possession-by-possession battle, teams need production beyond their primary stars.
Indiana received that production at exactly the right moments.
Mathurin supplied scoring.
McConnell supplied pressure and playmaking.
Turner supplied rim protection.
Haliburton supplied all-around control.
That combination allowed Indiana to overcome Oklahoma City’s strong stretches.
What the Game Says About Shai Gilgeous-Alexander’s Performance
It would be misleading to call Gilgeous-Alexander’s 24 points a poor performance.
The more accurate conclusion is that Indiana made his offense less efficient and less comfortable than it had been earlier in the series.
That distinction matters.
A star player does not need to have a bad statistical night for the opposing defense to succeed.
Indiana’s goal was to make Oklahoma City work harder for every scoring opportunity.
The Pacers achieved that particularly well in the fourth quarter.
The Thunder’s final-period scoring dropped to just 18 points, and their offensive efficiency collapsed as Indiana’s defensive pressure increased.
What the Game Says About Tyrese Haliburton
Haliburton’s 22 points, 11 assists and 9 rebounds were arguably the most balanced individual numbers of the game.
His performance also reflected the type of role required from a primary playmaker in a Finals series.
He did not need to score 30 or 35 points.
Instead, he influenced the game through:
- Scoring
- Passing
- Rebounding
- Ball control
- Late-game decision-making
His 11 assists were especially valuable because Indiana’s offensive success depended on creating good shots rather than relying exclusively on individual isolation scoring.
The Defensive Turning Point
The final stretch of the fourth quarter deserves special attention.
With less than nine minutes remaining, Indiana trailed 95-93. The Pacers then turned the game around defensively, allowing only nine points across the next seven and a half minutes.
That sequence explains the final score better than any individual scoring statistic.
The Pacers did not simply outscore Oklahoma City.
They made scoring extremely difficult.
Turner’s rim protection became more influential.
Perimeter pressure forced difficult decisions.
McConnell’s activity created turnovers.
Indiana’s defense prevented the Thunder from generating the same offensive rhythm they had established during the third quarter.
What Oklahoma City Could Have Done Better
The statistics point toward several areas where Oklahoma City could have improved.
Reduce Turnovers
Seventeen turnovers were costly against a team that generated 13 steals.
The Thunder needed cleaner possessions, particularly late in the fourth quarter.
Improve Fourth-Quarter Shot Quality
Scoring only 18 points in the final period was the most damaging offensive statistic.
The Thunder needed better shot creation once Indiana tightened its defense.
Maintain Ball Movement
Oklahoma City had 16 assists compared with Indiana’s 24.
More consistent ball movement could have helped create cleaner looks when Indiana’s perimeter defenders increased pressure.
Find More Consistent Supporting Production
Williams and Gilgeous-Alexander combined for 50 points.
That was strong.
But Indiana’s combination of Mathurin, Haliburton, McConnell and Turner produced a broader range of impact.
Oklahoma City needed more players to influence the game beyond scoring.
What Indiana Did Right
Indiana’s formula was clear.
1. Attack After Defensive Stops
The Pacers created pressure through steals and blocks, which helped them generate opportunities after defensive plays.
2. Use the Bench Aggressively
Mathurin and McConnell provided a major boost without requiring Haliburton to carry every possession.
3. Protect the Rim
Eleven blocks were a huge defensive statement.
Turner’s five blocks were particularly important in the closing stages.
4. Move the Ball
Twenty-four assists showed strong offensive connectivity.
5. Finish Strong
The most important adjustment was the fourth quarter.
Indiana entered the period trailing and still found a way to win by 14 points.
A Closer Look at the Team Records
The supplied game data also provides useful regular-season context.
Oklahoma City entered the matchup with a 68-14 regular-season record and a 32-8 road record.
Indiana entered with a 50-32 record and a 29-11 home record.
Those numbers explain why Oklahoma City was widely viewed as the stronger regular-season team.
Yet playoff basketball is not simply a continuation of regular-season performance.
Indiana’s 29-11 home record demonstrated that Gainbridge Fieldhouse was a difficult place to play. In Game 3, the Pacers used that home environment effectively.
The 17,274 fans created a strong Finals atmosphere, and Indiana became the first team to win a Finals game in Indianapolis in 25 years.
How to Read These Player Stats Correctly
If you are researching oklahoma city thunder vs pacers match player stats, it is useful to divide the numbers into four categories.
Scoring
Look at:
- Points
- Field goals
- Three-point shooting
- Free throws
This shows who produced points.
Creation
Look at:
- Assists
- Turnovers
- Usage of key possessions
This helps identify which players controlled offensive decisions.
Possession
Look at:
- Rebounds
- Steals
- Turnovers
These numbers show which team created or lost opportunities.
Defensive Impact
Look at:
- Steals
- Blocks
- Opponent shooting
- Fourth-quarter scoring
These numbers can explain why a team suddenly loses offensive efficiency.
Game 3 is an excellent example because Indiana did not dominate every category.
Instead, it won several of the categories that mattered most during the final minutes.
Most Important Player Performances
Here is a concise summary of the major individual performances.
| Player | Team | Key Production |
| Bennedict Mathurin | Pacers | 27 points |
| Tyrese Haliburton | Pacers | 22 points, 11 assists, 9 rebounds |
| T.J. McConnell | Pacers | 10 points, 5 assists, 5 steals |
| Myles Turner | Pacers | 5 blocks |
| Jalen Williams | Thunder | 26 points, 6 rebounds |
| Shai Gilgeous-Alexander | Thunder | 24 points |
| Chet Holmgren | Thunder | 10 rebounds, 13 early points |
| Luguentz Dort | Thunder | 12 points, 4-of-5 from three |
The statistics show that Indiana had more players influencing the game in different ways.
Oklahoma City Thunder vs Pacers Match Player Stats and the Series Picture
The Game 3 result gave Indiana a 2-1 lead in the NBA Finals.
That made the next game especially important because Oklahoma City needed to respond quickly to avoid falling further behind.
The Game 3 result also demonstrated a recurring characteristic of the Pacers’ postseason run: they were capable of recovering from difficult stretches rather than allowing an early deficit to decide the outcome.
For Oklahoma City, the main lesson was equally clear.
Having the lead entering the fourth quarter was not enough.
The Thunder needed to close.
Frequently Asked Questions
What was the final score of the Thunder vs Pacers Game 3?
The Indiana Pacers defeated the Oklahoma City Thunder 116-107 in Game 3 of the 2025 NBA Finals.
Who scored the most points in the game?
Bennedict Mathurin led all scorers with 27 points for Indiana.
How many points did Jalen Williams score?
Jalen Williams scored 26 points for Oklahoma City while shooting 9-of-18 from the field.
What were Tyrese Haliburton’s stats?
Tyrese Haliburton finished with 22 points, 11 assists and 9 rebounds, narrowly missing a triple-double.
Which team had more rebounds?
Oklahoma City had the rebounding advantage, collecting 42 rebounds compared with Indiana’s 36.
Why did the Pacers win Game 3?
Indiana won because it combined stronger ball movement, fewer turnovers, aggressive defense, bench scoring and a dominant fourth quarter. The Pacers outscored Oklahoma City 32-18 in the final period.
Conclusion
The oklahoma city thunder vs pacers match player stats from Game 3 show why Indiana was able to win despite Oklahoma City holding advantages in rebounds and three-point shooting.
Jalen Williams led the Thunder with 26 points, while Shai Gilgeous-Alexander added 24. Chet Holmgren controlled the glass with 10 rebounds. For Indiana, Bennedict Mathurin’s 27 points provided the game’s biggest scoring performance, while Tyrese Haliburton filled the box score with 22 points, 11 assists and 9 rebounds.
The decisive difference came from the overall balance of Indiana’s performance.
The Pacers had more assists, fewer turnovers, more steals and more blocks. Their defense became particularly effective in the fourth quarter, when they held Oklahoma City to only 18 points.
The final period transformed a five-point Thunder lead into a nine-point Indiana victory.
That makes Game 3 an important example of why basketball statistics should be viewed as a connected system rather than as isolated numbers. Shooting percentages tell part of the story, but turnovers, defensive events, playmaking, bench production and late-game execution can determine the result.
For anyone studying oklahoma city thunder vs pacers match player stats, the most useful takeaway is that Indiana did not win because one statistical category overwhelmed Oklahoma City. It won because several smaller advantages came together at the most important point of the game.