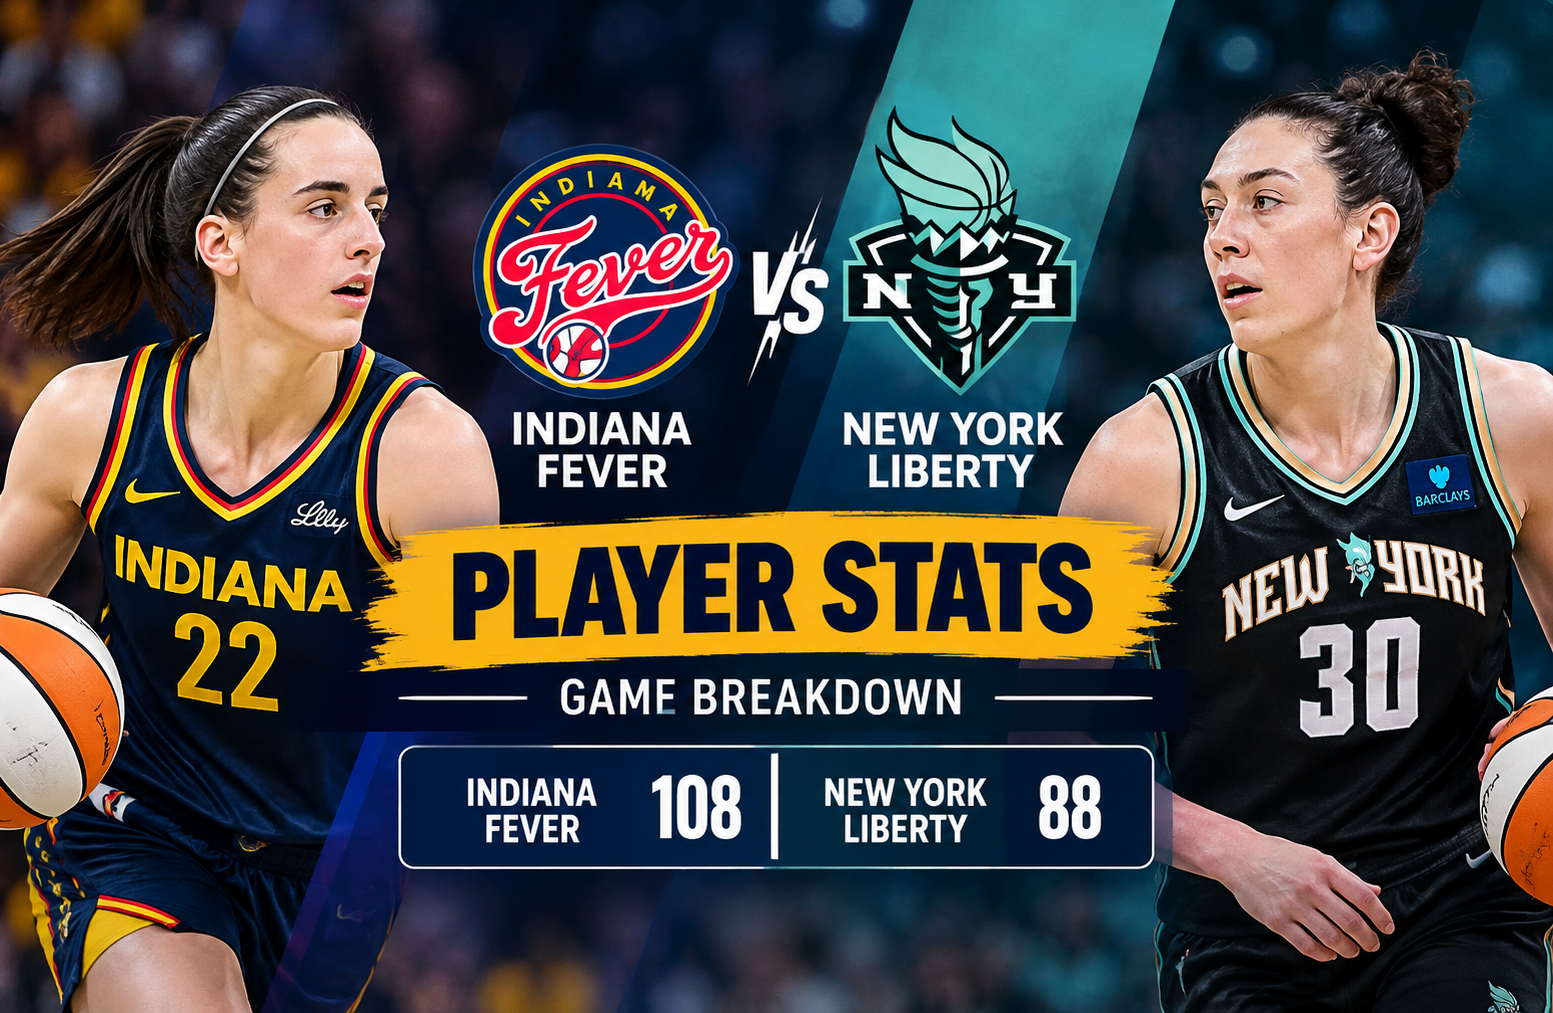
Indiana Fever vs New York Liberty Match Player Stats
The Indiana Fever vs New York Liberty match player stats from the July 19, 2026 matchup tell a much clearer story than the final score alone. Indiana defeated New York 108-88 at Gainbridge Fieldhouse in Indianapolis, producing one of its strongest offensive performances of the season. The Fever finished the game shooting 54% from the field and 50% from three, while Kelsey Mitchell led all scorers with 33 points.
The result was also important in the season series because this victory left the teams tied 2-2 in their matchups. Indiana’s offensive balance, three-point shooting, free-throw efficiency, and second-half scoring separated the teams. New York had individual production from Breanna Stewart, Jonquel Jones, Sabrina Ionescu, and Marine Johannes, but the Liberty could not match Indiana’s scoring efficiency across four quarters.
This article breaks down the player statistics, team numbers, shooting efficiency, individual performances, turning points, and the statistical lessons that can be taken from the game.
Indiana Fever vs New York Liberty Match Player Stats
The most important individual numbers from the game are shown below.
Indiana Fever Player Statistics
| Player | PTS | REB | AST | STL | BLK | FG |
| Kelsey Mitchell | 33 | 1 | 1 | 1 | 0 | 10-14 |
| Caitlin Clark | 17 | 2 | 7 | 0 | 0 | 5-14 |
| Aliyah Boston | 15 | 7 | 4 | 2 | 1 | 6-11 |
| Sophie Cunningham | 11 | 4 | 1 | 0 | 2 | 3-6 |
| Tyasha Harris | 11 | 2 | 4 | 0 | 0 | 4-8 |
| Lexie Hull | 8 | 2 | 2 | 2 | 0 | 3-5 |
| Myisha Hines-Allen | 5 | 3 | 1 | 2 | 0 | 2-3 |
| Makayla Timpson | 2 | 5 | 0 | 0 | 0 | 1-2 |
| Raven Johnson | 2 | 1 | 0 | 0 | 0 | 1-1 |
Kelsey Mitchell was the clear scoring leader. She finished with 33 points on 10-of-14 shooting, including 4-of-6 from three-point range and 9-of-13 at the free-throw line.
Caitlin Clark contributed 17 points and 7 assists, while Aliyah Boston supplied 15 points, 7 rebounds, and 4 assists. That combination gave Indiana three major offensive contributors rather than forcing the entire scoring load onto one player.
New York Liberty Player Statistics
| Player | PTS | REB | AST | STL | BLK | FG |
| Breanna Stewart | 26 | 8 | 3 | 1 | 3 | 10-16 |
| Jonquel Jones | 13 | 6 | 2 | 2 | 1 | 4-9 |
| Marine Johannes | 12 | 2 | 1 | 1 | 0 | 4-12 |
| Sabrina Ionescu | 12 | 1 | 4 | 1 | 0 | 4-9 |
| Pauline Astier | 9 | 2 | 5 | 3 | 0 | 3-6 |
| Anneli Maley | 5 | 3 | 0 | 0 | 0 | 1-5 |
| Raquel Carrera | 4 | 0 | 0 | 0 | 0 | 1-1 |
| Han Xu | 3 | 4 | 0 | 0 | 1 | 1-4 |
| Marine Fauthoux | 4 | 0 | 4 | 0 | 0 | 2-4 |
| Monique Billings | 4 | 6 | 2 | 0 | 1 | 2-5 |
| Rebecca Allen | 0 | 1 | 0 | 0 | 1 | 0-1 |
Breanna Stewart was New York’s leading scorer with 26 points. She shot 10-of-16 from the field and added 8 rebounds and 3 blocks. Her efficiency was one of the clearest positives for the Liberty.
The problem for New York was that Stewart’s production did not receive enough consistent scoring support. Only Jonquel Jones reached double figures alongside Stewart among the frontcourt group, while Sabrina Ionescu and Marine Johannes each finished with 12.
The Final Score Tells Only Part of the Story
Indiana won 108-88, but the quarter-by-quarter scoring explains how the margin developed.
| Quarter | Indiana | New York |
| 1st | 22 | 28 |
| 2nd | 23 | 21 |
| 3rd | 30 | 12 |
| 4th | 33 | 27 |
| Final | 108 | 88 |
New York actually won the opening quarter 28-22.
That makes the final result even more revealing.
Indiana did not begin the game by immediately overwhelming the Liberty. Instead, the Fever gradually changed the game through efficiency and increased offensive production. The biggest swing came in the third quarter, when Indiana scored 30 points while holding New York to only 12.
That 18-point third-quarter advantage effectively transformed a competitive game into a comfortable Indiana lead.
The Fever then scored another 33 points in the fourth quarter, preventing New York from producing a meaningful comeback.
Kelsey Mitchell Was the Defining Offensive Player
The most important individual performance in the Indiana Fever vs New York Liberty match player stats was Kelsey Mitchell’s 33-point effort.
Her shooting line was:
- 33 points
- 10-of-14 field goals
- 4-of-6 three-pointers
- 9-of-13 free throws
- 1 rebound
- 1 assist
- 1 steal
The most impressive part was not simply the number of points. It was the combination of volume and efficiency.
Mitchell attempted only 14 field goals and still scored 33 points. Her 10-of-14 shooting represents approximately 71.4% from the field. Her 4-of-6 three-point shooting was approximately 66.7%.
She also converted nine free throws.
That efficiency placed considerable pressure on the Liberty defense.
When an elite perimeter scorer is converting at that level, defensive adjustments become difficult because aggressive help can open passing lanes while staying home can allow the scorer to continue attacking one-on-one.
Indiana benefited from exactly that kind of pressure.
Caitlin Clark’s 17 Points and 7 Assists
Caitlin Clark did not lead Indiana in scoring, but her 17 points and 7 assists were important to the overall offensive structure.
Her shooting numbers were:
- 17 points
- 5-of-14 field goals
- 2-of-8 three-pointers
- 5-of-5 free throws
- 2 rebounds
- 7 assists
- 7 turnovers
The seven turnovers are an important part of evaluating her performance.
It would be inaccurate to describe the game as an entirely efficient individual shooting night for Clark. She shot 35.7% from the field and 25% from three.
However, box-score evaluation should not stop at field-goal percentage.
Clark created seven assists and helped maintain Indiana’s offensive flow. Her ability to create opportunities for teammates was particularly valuable because Mitchell was shooting at such a high level.
The best interpretation is therefore mixed: strong playmaking impact, solid scoring contribution, but an unusually high turnover count and modest shooting efficiency.
That distinction is important when analyzing player statistics objectively.
Aliyah Boston Provided Interior Balance
Aliyah Boston finished with:
- 15 points
- 7 rebounds
- 4 assists
- 2 steals
- 1 block
- 6-of-11 shooting
- 1-of-2 from three
- 2-of-3 free throws
Boston’s contribution helped Indiana avoid becoming overly dependent on perimeter scoring.
That balance is one of the most useful lessons from the game.
Mitchell supplied elite perimeter scoring. Clark supplied playmaking and additional scoring. Boston provided interior scoring, rebounding, and defensive activity.
When those three roles work together, the opposing defense has fewer easy solutions.
If the Liberty focused too heavily on Mitchell, Indiana had other scoring options. If defenders closed out aggressively on the perimeter, Boston could contribute inside.
Breanna Stewart Led New York
Breanna Stewart was the Liberty’s strongest individual performer.
She recorded:
- 26 points
- 8 rebounds
- 3 assists
- 1 steal
- 3 blocks
- 10-of-16 field goals
- 2-of-4 three-pointers
- 4-of-9 free throws
Stewart’s 10 made field goals were tied with Mitchell for the game high.
Her 62.5% field-goal shooting was also highly efficient.
The issue was not Stewart’s individual production.
The issue was the difference between her efficiency and the Liberty’s overall offensive performance.
New York finished 30-of-67 from the field, which equals approximately 44.8%. Indiana finished 37-of-69, or approximately 53.6%.
That nearly nine-percentage-point difference is substantial over 69 Indiana field-goal attempts.
Sabrina Ionescu’s Contribution
Sabrina Ionescu finished with:
- 12 points
- 1 rebound
- 4 assists
- 1 steal
- 4-of-9 field goals
- 2-of-4 three-pointers
- 2-of-4 free throws
- 1 turnover
Her low turnover count was a positive.
However, 12 points were not enough to offset the scoring gap created by Indiana’s perimeter attack.
Ionescu’s role becomes particularly important in games where Stewart is producing efficiently. When Stewart scores 26, the Liberty need secondary scorers to convert enough opportunities to keep pace with a high-scoring opponent.
That did not happen consistently in this matchup.
Marine Johannes Had a Difficult Shooting Night
Marine Johannes scored 12 points, but her shooting profile was much less efficient than Stewart’s or Mitchell’s.
She went:
- 4-of-12 from the field
- 4-of-11 from three
- 12 points
- 2 rebounds
- 1 assist
- 3 turnovers
- 1 steal
Her four made three-pointers were valuable, but she needed 11 attempts from beyond the arc to produce them.
This illustrates why made three-pointers should always be viewed alongside attempts.
A player making four threes sounds impressive. But four makes on 11 attempts is a different efficiency story from four makes on six attempts.
Team Shooting Was the Biggest Statistical Difference
The team shooting numbers reveal why Indiana won so comfortably.
Indiana
- 37-of-69 from the field
- 54% field-goal shooting
- 14-of-28 from three
- 50% three-point shooting
- 20-of-27 free throws
- 74% free-throw shooting
New York
- 30-of-67 from the field
- 45% field-goal shooting
- 13-of-32 from three
- 41% three-point shooting
- 15-of-25 free throws
- 60% free-throw shooting
New York actually made only one fewer three-pointer than Indiana.
The larger difference came from overall field-goal efficiency and free throws.
Indiana made seven more field goals despite taking only two additional attempts.
That is an enormous difference in scoring efficiency.
The Fever also converted five more free throws.
Together, those differences helped explain the 20-point final margin.
Indiana Won the Rebounding Battle
Indiana collected 32 rebounds compared with 27 for New York.
The difference was not enormous, but it supported the Fever’s offensive efficiency.
Indiana recorded:
- 8 offensive rebounds
- 24 defensive rebounds
New York recorded:
- 7 offensive rebounds
- 20 defensive rebounds
The five-rebound advantage helped Indiana control more possessions and limit some of New York’s second-chance opportunities.
Rebounding was not the only reason Indiana won, but it contributed to the overall statistical advantage.
Assists Showed Indiana’s Offensive Balance
Indiana recorded 22 assists compared with 19 for New York.
That three-assist difference may look modest, but it becomes more meaningful when combined with the Fever’s shooting efficiency.
Indiana was not simply making difficult individual shots.
The team generated enough assisted offense to keep the ball moving and create quality opportunities.
Clark led Indiana with 7 assists.
Boston and Tyasha Harris each added 4.
That distribution suggests that Indiana’s offensive creation was not limited to one player.
Turnovers Were a Major Concern for Indiana
One of the most interesting statistical contradictions was Indiana’s turnover total.
The Fever committed 16 turnovers.
New York committed 15.
So Indiana won by 20 points despite turning the ball over one more time.
This is significant because it shows that shooting efficiency overwhelmed the small possession disadvantage.
Clark accounted for seven of Indiana’s turnovers, meaning nearly half of the team’s turnovers came from one player.
Yet Indiana still scored 108 points.
That is a useful analytical reminder: turnovers matter, but they should be evaluated alongside shooting, rebounding, free throws, and offensive efficiency.
The Third Quarter Changed the Game
The third quarter deserves special attention.
Indiana scored 30 points.
New York scored only 12.
That 30-12 period created an 18-point swing.
There are several ways to interpret such a quarter.
First, Indiana’s offense became more efficient.
Second, New York’s scoring disappeared for a prolonged stretch.
Third, Indiana’s ability to combine perimeter shooting with interior contributions made it difficult for New York to recover.
By the end of the third quarter, the game had shifted from a contest into a situation where Indiana controlled the scoreboard.
Indiana’s 108 Points Were Built on Multiple Scoring Sources
Indiana’s scoring distribution was unusually balanced for a team with one player scoring 33.
Mitchell had 33.
Clark had 17.
Boston had 15.
Cunningham had 11.
Harris had 11.
Hull had 8.
Hines-Allen had 5.
Timpson had 2.
Johnson had 2.
That means five Indiana players scored at least 11 points.
New York, by comparison, had only four players reach double figures.
That difference in scoring depth is important.
A team can survive an opponent’s star performance if it receives enough production from its supporting cast.
Indiana’s supporting players collectively gave Mitchell enough help to make New York’s defensive challenge much harder.
Sophie Cunningham and Tyasha Harris Added Valuable Scoring
Sophie Cunningham scored 11 points while shooting 3-of-6 from the field and 3-of-4 from three-point range.
That was an important perimeter contribution.
Tyasha Harris also scored 11 points on 4-of-8 shooting and added 4 assists.
These performances show why bench and secondary production can have an outsized impact in high-scoring games.
The Fever did not need Clark to score 30.
They did not need Boston to dominate offensively.
Instead, Indiana received meaningful contributions from multiple players.
That is often a more sustainable offensive formula than depending entirely on one star.
Comparing the Two Teams Statistically
| Category | Indiana Fever | New York Liberty |
| Points | 108 | 88 |
| FG | 37-69 | 30-67 |
| FG% | 54% | 45% |
| 3PT | 14-28 | 13-32 |
| 3PT% | 50% | 41% |
| FT | 20-27 | 15-25 |
| FT% | 74% | 60% |
| Rebounds | 32 | 27 |
| Assists | 22 | 19 |
| Turnovers | 16 | 15 |
| Steals | 7 | 8 |
| Blocks | 5 | 6 |
| Offensive Rebounds | 8 | 7 |
| Defensive Rebounds | 24 | 20 |
| Personal Fouls | 24 | 24 |
The table makes the result easier to understand.
Indiana was better in field-goal percentage, three-point percentage, free-throw percentage, rebounds, assists, and total scoring.
New York had small advantages in turnovers, steals, and blocks.
Those defensive categories were not enough to compensate for Indiana’s offensive efficiency.
What the Player Stats Reveal About Indiana
The biggest lesson from the Fever numbers is offensive versatility.
Indiana did not win because one player had an extraordinary scoring night.
Mitchell certainly had an extraordinary game, but the surrounding statistics show a broader team performance.
Clark created seven assists.
Boston produced 15 points and seven rebounds.
Cunningham hit three three-pointers.
Harris added 11 points and four assists.
Hull supplied eight points and two steals.
That combination gave Indiana several ways to attack.
The Fever’s 108-point total is therefore better understood as a team offensive performance rather than simply a Mitchell showcase.
What the Player Stats Reveal About New York
New York’s numbers reveal a very different problem.
The Liberty had a strong individual performance from Stewart.
They also received respectable contributions from Jones, Ionescu, Johannes, and Astier.
But the overall efficiency was not high enough.
The Liberty shot 45% from the field, 41% from three, and only 60% from the free-throw line.
The free-throw number stands out.
New York went 15-of-25.
Ten missed free throws represent ten lost scoring opportunities.
Against a team that scores 108 points, missed free throws become especially costly.
The Importance of Free Throws
Indiana made 20 of 27 free throws.
New York made 15 of 25.
Indiana therefore made five more free throws.
The difference in free-throw percentage was also significant.
Indiana converted 74%.
New York converted 60%.
Free throws are among the easiest scoring opportunities available in basketball because there is no defensive contest during the shot itself.
Missing ten free throws does not automatically explain a 20-point defeat, but it contributes to the gap.
Had New York converted at Indiana’s 74% rate, the Liberty would have scored several additional points.
Three-Point Shooting Was Also Important
Indiana made 14 three-pointers.
New York made 13.
At first glance, that difference seems insignificant.
But Indiana attempted only 28 three-pointers compared with New York’s 32.
Indiana therefore achieved more made threes with four fewer attempts.
That reflects better three-point efficiency.
The Fever shot 50% from beyond the arc.
The Liberty shot 41%.
A nine-percentage-point difference from three is meaningful, especially when both teams attempt more than 25 shots from that range.
Why the 20-Point Margin Was Logical
A 20-point result can sometimes come from a late-game collapse or a handful of unusual possessions.
This game was different.
The statistical profile supports the margin.
Indiana:
- Shot 54% overall
- Shot 50% from three
- Made 20 free throws
- Won the rebounding battle
- Had three players score at least 15
- Had five players score at least 11
- Scored 63 points in the second half
New York:
- Shot 45% overall
- Shot 41% from three
- Made only 15 free throws
- Scored 39 points in the second half
- Scored only 12 points in the third quarter
The result was therefore supported by several independent statistical advantages.
Season-Series Context
The July matchup was especially meaningful because it left the season series tied 2-2.
That means neither team could claim overall statistical dominance across their four meetings based solely on this result.
Instead, the matchup showed how dramatically individual games can differ.
A team can have success in one meeting and struggle in another because of shooting variance, injuries, rotations, defensive schemes, pace, and player availability.
For anyone researching head-to-head statistics, this is why a single box score should be considered alongside the broader series record.
How to Read These Player Stats Correctly
If you are using the Indiana Fever vs New York Liberty match player stats to evaluate individual performance, avoid focusing only on points.
A better approach is to examine five areas.
1. Scoring Efficiency
Look at points alongside field-goal attempts.
Mitchell’s 33 points on 14 shots is far more efficient than simply saying she scored 33.
2. Playmaking
Assists help reveal offensive creation.
Clark’s seven assists and Boston’s four assists added another dimension to Indiana’s offense.
3. Rebounding
Rebounding helps indicate possession control.
Indiana’s 32 rebounds compared with New York’s 27 gave the Fever an additional statistical advantage.
4. Turnovers
Turnovers can erase offensive possessions.
Clark’s seven turnovers were therefore important even though her overall offensive contribution was positive.
5. Shooting From Three and the Free-Throw Line
Modern basketball games can change quickly based on shooting efficiency.
Indiana’s 50% three-point shooting and 74% free-throw shooting were major contributors to the final result.
Practical Takeaways for Basketball Analysts
This matchup offers several useful lessons for anyone studying basketball statistics.
First, scoring totals should never be examined without attempts.
Second, a player’s efficiency can be more revealing than raw scoring.
Third, team depth matters.
Fourth, quarter-by-quarter data can reveal momentum that a final box score hides.
Fifth, turnovers need context.
Indiana committed 16 turnovers and still won by 20 because its shooting and scoring advantages were much larger.
Finally, one outstanding individual performance does not guarantee a team victory.
Stewart scored 26 points on excellent shooting, but New York still lost by 20.
Frequently Asked Questions
What was the final score between Indiana Fever and New York Liberty?
Indiana Fever defeated New York Liberty 108-88 at Gainbridge Fieldhouse.
Who scored the most points in the game?
Kelsey Mitchell led all scorers with 33 points for Indiana. She shot 10-of-14 from the field and made 4-of-6 three-point attempts.
How many points did Caitlin Clark score?
Caitlin Clark scored 17 points and added 7 assists. She also had 7 turnovers.
How many points did Breanna Stewart score?
Breanna Stewart scored 26 points for New York, along with 8 rebounds, 3 assists, and 3 blocks.
Which team shot better?
Indiana shot better from both the field and three-point range. The Fever shot 54% overall and 50% from three, compared with 45% and 41% for New York.
What was the season series after this game?
The season series was tied 2-2 after Indiana’s 108-88 victory.
Conclusion
The Indiana Fever vs New York Liberty match player stats show that Indiana’s 108-88 victory was built on much more than one big scoring performance.
Kelsey Mitchell was the headline performer with 33 points on highly efficient shooting. Caitlin Clark contributed 17 points and 7 assists, although her seven turnovers were a clear area of concern. Aliyah Boston added 15 points, 7 rebounds, and 4 assists, while Sophie Cunningham and Tyasha Harris each reached 11 points.
For New York, Breanna Stewart delivered 26 points and 8 rebounds while shooting 10-of-16 from the field. Jonquel Jones added 13 points and 6 rebounds, while Sabrina Ionescu and Marine Johannes each scored 12.
The decisive difference was team efficiency.
Indiana shot 54% from the field, 50% from three, and 74% from the free-throw line. New York finished at 45%, 41%, and 60%, respectively. Indiana also won the rebounding battle 32-27 and assisted on 22 baskets compared with New York’s 19.
Most importantly, the third quarter changed everything. Indiana outscored New York 30-12 before finishing the game with 33 points in the fourth quarter.
The result left the season series tied at 2-2, but this particular matchup belonged clearly to Indiana. The box score demonstrates why: the Fever combined elite perimeter shooting, balanced scoring, efficient free throws, and strong second-half execution to turn an initially competitive game into a 20-point victory.