76ers vs Charlotte Hornets Match Player Stats
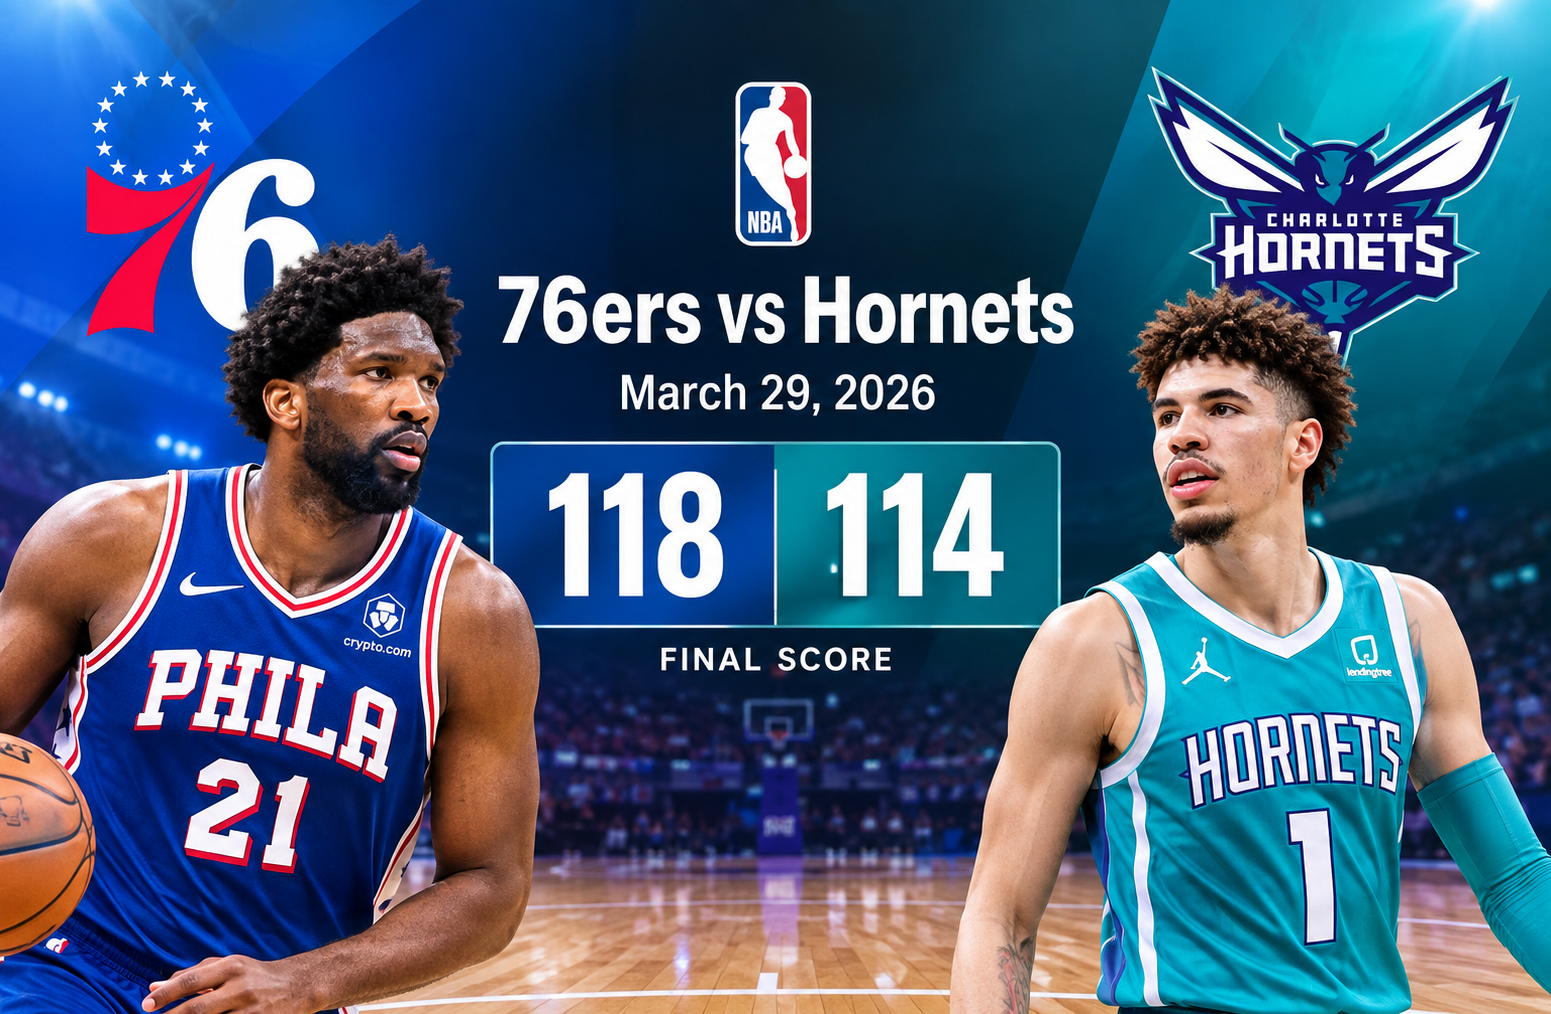
The 76ers vs charlotte hornets match player stats from March 29, 2026, tell the story of a close game that Philadelphia won 118-114 at Spectrum Center in Charlotte. The final score looks tight, but the underlying numbers reveal several important differences between the two teams. Philadelphia converted its possessions more efficiently, protected the basketball, and produced enough three-point shooting to overcome Charlotte’s major rebounding advantage.
Joel Embiid led Philadelphia with 29 points, while Paul George and Tyrese Maxey each added 26. George also controlled the glass with 13 rebounds, and Maxey supplied a team-high 8 assists. For Charlotte, Brandon Miller scored 29 points, LaMelo Ball finished with 20 points and 8 assists, while Coby White contributed 16 points. Moussa Diabate and Kon Knueppel each grabbed 11 rebounds.
The game was also significant from a team-performance perspective. Philadelphia finished 40-for-82 from the field, good for 49 percent, and made 16 of 34 three-point attempts for an excellent 47 percent. Charlotte attempted 96 field goals but converted only 36, producing a 38 percent field-goal percentage. That efficiency gap became one of the clearest explanations for Philadelphia’s four-point victory.
76ers vs charlotte hornets match player stats at a glance
The most useful way to begin analyzing this matchup is to separate the individual performances from the overall team numbers.
| Category | Philadelphia 76ers | Charlotte Hornets |
| Final Score | 118 | 114 |
| Field Goals | 40-82 | 36-96 |
| Field Goal Percentage | 49% | 38% |
| Three-Pointers | 16-34 | 17-55 |
| Three-Point Percentage | 47% | 31% |
| Free Throws | 22-29 | 25-32 |
| Free Throw Percentage | 76% | 78% |
| Rebounds | 41 | 53 |
| Assists | 19 | 18 |
| Turnovers | 9 | 9 |
| Steals | 7 | 4 |
| Blocks | 5 | 1 |
Philadelphia won despite being outrebounded 53-41. That is an important part of the story because it shows that rebounding alone did not determine the outcome. Charlotte had a 12-rebound advantage, but Philadelphia made better use of its shooting opportunities.
Philadelphia also had a major advantage from beyond the arc. The 76ers made 16 three-pointers on 34 attempts, while Charlotte made 17 on 55 attempts. Charlotte actually made one more three-pointer, but Philadelphia needed 21 fewer attempts to get there.
That difference in shooting efficiency is one of the strongest statistical signals in the entire game.
Philadelphia 76ers player performance
Philadelphia’s scoring was led by three major offensive contributors. Joel Embiid scored 29 points, while Paul George and Tyrese Maxey each recorded 26.
Together, those three players accounted for 81 of Philadelphia’s 118 points. That means the trio produced more than two-thirds of the team’s total scoring.
Joel Embiid leads Philadelphia with 29 points
Joel Embiid was Philadelphia’s leading scorer with 29 points.
His scoring output was particularly important because Charlotte had enough offensive production to remain competitive throughout the game. A high-level scoring performance from Embiid gave Philadelphia a dependable source of points while the team navigated Charlotte’s strong rebounding numbers.
Embiid’s 29 points also matched Brandon Miller’s 29 points on the Charlotte side, creating an interesting statistical parallel between the two leading scorers.
When looking at the game as a whole, Embiid’s contribution should not be judged only by the final point total. Philadelphia’s offense was highly efficient overall, shooting 49 percent from the field. That suggests the team was able to generate quality scoring opportunities and convert them at a strong rate.
Paul George delivers a complete performance
Paul George scored 26 points and led Philadelphia with 13 rebounds.
The rebounding figure is especially notable because Charlotte won the overall rebounding battle 53-41. George’s 13 boards therefore represented a major individual contribution toward limiting what could otherwise have been an even larger Charlotte advantage on the glass.
His 26 points also placed him alongside Maxey as Philadelphia’s second-highest scoring contributor.
This combination of scoring and rebounding makes George one of the most influential individual performers in the matchup. While Embiid led the team in points, George supplied an important two-way statistical contribution.
Tyrese Maxey adds 26 points and 8 assists
Tyrese Maxey finished with 26 points and led Philadelphia with 8 assists.
The 8-assist total matters because Philadelphia finished with 19 assists as a team. Maxey therefore accounted for a substantial share of the team’s playmaking production.
His 26 points also gave Philadelphia another high-volume scoring option. That balance made it harder for Charlotte to rely on containing one primary offensive player.
Philadelphia’s three leading scorers combined for 81 points, but Maxey’s passing helped connect the scoring production across the offense.
Charlotte Hornets player performance
Charlotte also received strong individual performances, especially from Brandon Miller, LaMelo Ball, Coby White, Moussa Diabate, and Kon Knueppel.
The problem for Charlotte was not a complete absence of production. Instead, the team’s overall shooting efficiency prevented those individual performances from translating into a win.
Brandon Miller matches the game-high with 29 points
Brandon Miller led Charlotte with 29 points.
His scoring total matched Joel Embiid’s 29 points, meaning the two teams’ leading scorers produced exactly the same number of points.
Miller’s contribution was crucial because Charlotte trailed by only four points at the final buzzer. In a game decided by such a small margin, every major scoring performance matters.
However, Charlotte’s 38 percent overall field-goal shooting shows that its offense struggled to convert a large number of attempts efficiently. Miller’s 29 points helped keep the Hornets competitive, but the team needed more consistent shooting across the lineup.
LaMelo Ball contributes 20 points and 8 assists
LaMelo Ball finished with 20 points and 8 assists.
His 8 assists matched Maxey’s team-leading total for Philadelphia. This gives both point guards an interesting statistical comparison.
Maxey scored 26 points and recorded 8 assists, while Ball produced 20 points and 8 assists.
The difference was therefore primarily scoring efficiency and overall team shooting rather than playmaking volume from these two players.
Ball also helped Charlotte maintain offensive pressure despite Philadelphia’s defensive activity. The 76ers finished with 7 steals and 5 blocks, but Charlotte still produced 114 points.
Coby White adds 16 points
Coby White scored 16 points for Charlotte.
Although his total was below the leading contributions from Miller and Ball, White was one of the three highest scorers listed for the Hornets.
Charlotte needed additional scoring because Philadelphia’s offense was highly efficient. A 49 percent shooting night combined with 16 made three-pointers meant that the Hornets had little margin for missed opportunities.
White’s 16 points therefore formed part of Charlotte’s broader effort to keep the game close.
Diabate and Knueppel dominate the boards
Moussa Diabate and Kon Knueppel each recorded 11 rebounds.
Their performances were a major reason Charlotte finished with 53 total rebounds compared with Philadelphia’s 41.
A 12-rebound team advantage is significant. It indicates that Charlotte was creating additional opportunities through its work on the glass.
However, the advantage did not translate into enough additional scoring efficiency. This is an important lesson when evaluating box scores. Winning one statistical category does not necessarily mean winning the game.
Charlotte controlled the boards, but Philadelphia controlled shooting efficiency.
Quarter-by-quarter breakdown
The game changed considerably from quarter to quarter.
Philadelphia’s quarter scores were 25, 39, 28, and 26.
Charlotte’s quarter scores were 36, 33, 28, and 17.
| Quarter | Philadelphia | Charlotte |
| 1st | 25 | 36 |
| 2nd | 39 | 33 |
| 3rd | 28 | 28 |
| 4th | 26 | 17 |
| Total | 118 | 114 |
Charlotte won the first quarter 36-25, establishing an 11-point advantage.
That early lead could have changed the entire game, but Philadelphia responded strongly in the second quarter. The 76ers scored 39 points while Charlotte produced 33.
Philadelphia therefore reduced the deficit by six points before halftime.
The third quarter was completely even at 28-28. Neither team gained ground, leaving the contest positioned for a decisive fourth quarter.
The final period became the turning point.
Philadelphia scored 26 points, while Charlotte managed only 17. That nine-point fourth-quarter advantage was enough to overturn the earlier deficit and secure the 118-114 victory.
The fourth quarter decided the game
One of the most useful insights from these 76ers vs charlotte hornets match player stats is how clearly the final quarter influenced the result.
Charlotte entered the fourth quarter with a lead created largely by its first-quarter performance. Yet Philadelphia produced the better closing period.
Scoring 26 points in the final quarter while holding Charlotte to 17 allowed the 76ers to finish the comeback.
This is an important distinction between a team that plays well for stretches and a team that executes when the game is decided. Charlotte had the stronger opening, but Philadelphia finished more effectively.
The fourth-quarter numbers also help explain why the final score was not simply a reflection of the first three periods. Philadelphia improved its position at the exact point when possessions became most valuable.
Shooting efficiency was the biggest statistical difference
The clearest numerical advantage for Philadelphia was shooting efficiency.
The 76ers shot:
- 40-for-82 from the field
- 49 percent overall
- 16-for-34 from three-point range
- 47 percent from three
- 22-for-29 from the free-throw line
- 76 percent from the free-throw line
Charlotte shot:
- 36-for-96 from the field
- 38 percent overall
- 17-for-55 from three-point range
- 31 percent from three
- 25-for-32 from the free-throw line
- 78 percent from the free-throw line
Charlotte’s free-throw shooting was slightly better, but that small advantage could not compensate for the difference in field-goal efficiency.
The three-point numbers are particularly revealing.
Charlotte made 17 threes compared with Philadelphia’s 16. At first glance, that might suggest Charlotte performed similarly from long range.
The attempts tell a different story.
Philadelphia needed only 34 three-point attempts to make 16. Charlotte needed 55 attempts to make 17.
That means Philadelphia converted a far greater proportion of its three-point opportunities.
Why Charlotte’s 53 rebounds were not enough
Rebounding was Charlotte’s strongest statistical category.
The Hornets collected 53 rebounds, compared with 41 for Philadelphia.
A 12-rebound advantage normally provides a team with a meaningful opportunity to generate extra possessions and second-chance scoring. Yet Charlotte still lost.
The reason is that possession volume and possession efficiency are different things.
Charlotte generated plenty of opportunities, but its 38 percent field-goal shooting limited the value of those possessions.
Philadelphia, meanwhile, made its offensive opportunities count at a much higher rate.
This is why analysts should avoid evaluating a basketball game through a single box-score category. A team can dominate rebounds and still lose if it struggles to convert shots.
Turnovers were nearly identical
Both teams committed 9 turnovers.
This is another useful part of the statistical comparison because neither side created a meaningful advantage through ball security.
Philadelphia’s 9 turnovers represented a relatively controlled offensive performance, especially considering the team produced 118 points.
Charlotte also committed only 9 turnovers, so the loss cannot be explained by excessive mistakes with the basketball.
Instead, shooting efficiency and late-game execution were much more important.
Assists show a close playmaking battle
Philadelphia finished with 19 assists, while Charlotte recorded 18.
The one-assist difference shows that both teams had similar overall assist production.
Maxey and Ball both finished with 8 assists, making them the leading playmakers for their respective teams.
The numbers suggest that neither team had an overwhelming advantage in creating assisted scoring opportunities.
Once again, the larger difference was how effectively the teams converted their chances.
Philadelphia’s defensive activity
Philadelphia recorded 7 steals and 5 blocks.
Charlotte finished with 4 steals and 1 block.
That gives Philadelphia a combined 12 steals and blocks compared with Charlotte’s 5.
These statistics do not tell the entire defensive story, but they demonstrate that Philadelphia generated more disruptive defensive plays.
The 76ers were able to pressure the Hornets without allowing the turnover battle to become one-sided. Charlotte still committed only 9 turnovers, so Philadelphia’s defensive impact cannot be measured purely through forced mistakes.
The five blocks are also noteworthy because Charlotte recorded only one.
Charlotte’s offensive volume versus Philadelphia’s efficiency
Charlotte attempted 96 field goals, 14 more than Philadelphia’s 82 attempts.
Yet Philadelphia scored 118 points compared with Charlotte’s 114.
This creates one of the most interesting statistical contrasts in the game.
Charlotte had more field-goal attempts.
Philadelphia had fewer attempts but scored more points.
That outcome is a textbook example of why shot quality and efficiency matter.
A team taking more shots is not automatically generating more offense. The percentage at which those shots are converted is equally important.
Philadelphia’s 49 percent field-goal shooting allowed it to make better use of its possessions.
Comparing the leading scorers
The leading scorers for both teams finished on exactly 29 points.
| Player | Team | Points |
| Joel Embiid | Philadelphia | 29 |
| Brandon Miller | Charlotte | 29 |
| Paul George | Philadelphia | 26 |
| Tyrese Maxey | Philadelphia | 26 |
| LaMelo Ball | Charlotte | 20 |
| Coby White | Charlotte | 16 |
This comparison shows that Philadelphia had three players at 26 points or more, while Charlotte had one player at 29 and its next two listed scorers at 20 and 16.
That scoring distribution gave Philadelphia greater support around its leading scorer.
The difference was not that Charlotte lacked a star performance. Miller matched Embiid’s scoring total.
The difference was the broader scoring balance.
Rebounding comparison
Rebounding was heavily tilted toward Charlotte.
| Player | Team | Rebounds |
| Paul George | Philadelphia | 13 |
| Moussa Diabate | Charlotte | 11 |
| Kon Knueppel | Charlotte | 11 |
Charlotte’s two leading rebounders each reached 11 boards, while George led all listed players with 13.
At the team level, Charlotte’s 53 rebounds represented one of its strongest advantages.
Still, Philadelphia’s ability to overcome that deficit shows how strongly shooting efficiency influenced the game.
Playmaking comparison
The leading assist numbers were identical.
| Player | Team | Assists |
| Tyrese Maxey | Philadelphia | 8 |
| LaMelo Ball | Charlotte | 8 |
Maxey paired his 8 assists with 26 points.
Ball paired his 8 assists with 20 points.
This is another example of how individual statistics can look similar in one category while producing different overall offensive outcomes.
Both players created opportunities for teammates, but Maxey added more scoring to his individual production.
What the team shooting percentages reveal
Philadelphia’s 49 percent field-goal percentage was 11 percentage points higher than Charlotte’s 38 percent.
That is a substantial difference.
The 76ers also shot 47 percent from three-point range compared with Charlotte’s 31 percent.
The three-point percentage gap was even more important because three-point shots carry greater scoring value when converted.
Philadelphia made 16 threes.
Charlotte made 17.
Yet Philadelphia’s superior accuracy meant its long-range shooting was considerably more efficient.
This is likely one of the strongest statistical explanations for why the 76ers were able to win despite Charlotte’s rebounding advantage.
Free-throw shooting was not the deciding factor
Charlotte actually had a small advantage at the free-throw line.
Philadelphia made 22 of 29 free throws for 76 percent.
Charlotte made 25 of 32 for 78 percent.
The difference in percentage was only two points, and Charlotte made three more free throws.
However, the overall offensive efficiency gap was much larger.
This means the free-throw advantage was not enough to overcome Philadelphia’s superior field-goal and three-point shooting.
Season records add context
Philadelphia entered the game with a 41-33 record and a 20-16 road record.
Charlotte entered with a 39-35 record and a 19-18 home record.
The records show that both teams were closely positioned overall.
Philadelphia had two more wins and two fewer losses entering the matchup.
The road and home records were also relatively close, with Philadelphia holding a 20-16 away record and Charlotte posting a 19-18 home record.
That context makes the four-point Philadelphia victory even more understandable as a competitive matchup rather than a mismatch.
Season series result
Philadelphia won the season series 2-1.
That gives the March 29 game additional significance when reviewing the broader matchup between the teams.
A 2-1 season-series result means Philadelphia won two of the three meetings.
For readers researching individual game statistics, this is useful context because one game does not always represent the complete relationship between two teams.
The March 29 result formed part of a larger three-game season series that ultimately favored Philadelphia.
Game flow and momentum
The quarter scores provide a clear picture of momentum.
Charlotte opened with a 36-point first quarter and built an 11-point advantage.
Philadelphia answered immediately with a 39-point second quarter.
The third quarter was balanced.
Then Philadelphia closed the game with a nine-point fourth-quarter advantage.
This progression suggests that the game was not decided by one sustained run from beginning to end. Instead, the momentum shifted over different stages.
Charlotte’s early offensive success was real, but Philadelphia adjusted well enough to erase the deficit.
The fourth quarter ultimately separated the teams.
The most important player-stat takeaways
For someone researching the 76ers vs charlotte hornets match player stats, the following points summarize the game more effectively than the final score alone:
- Joel Embiid led all Philadelphia scorers with 29 points.
- Brandon Miller matched Embiid with 29 points for Charlotte.
- Paul George scored 26 points and led Philadelphia with 13 rebounds.
- Tyrese Maxey scored 26 points and recorded 8 assists.
- LaMelo Ball produced 20 points and 8 assists.
- Coby White added 16 points for Charlotte.
- Moussa Diabate and Kon Knueppel each grabbed 11 rebounds.
- Philadelphia shot 49 percent from the field.
- Charlotte shot 38 percent from the field.
- Philadelphia made 16 of 34 three-point attempts.
- Charlotte made 17 of 55 three-point attempts.
- Charlotte won the rebounding battle 53-41.
- Both teams committed exactly 9 turnovers.
- Philadelphia had more steals and blocks.
- Philadelphia won the fourth quarter 26-17.
- Philadelphia won the game 118-114.
- Philadelphia won the season series 2-1.
A deeper look at efficiency versus volume
One of the most valuable lessons from this game is the difference between volume and efficiency.
Charlotte’s 96 field-goal attempts were significantly higher than Philadelphia’s 82.
The Hornets also attempted 55 three-pointers, compared with 34 for Philadelphia.
Yet the 76ers produced the higher score.
The reason is simple: Philadelphia converted a much larger percentage of its attempts.
This is an important principle when interpreting basketball statistics. High shot volume can help a team, but only if the team can generate enough successful possessions from that volume.
Charlotte’s 53 rebounds probably contributed to its ability to generate additional attempts. However, the Hornets’ 38 percent field-goal shooting reduced the value of those extra opportunities.
Philadelphia did not need as many attempts because it converted more efficiently.
How the fourth quarter changed the statistical story
If the game had been evaluated only after the first quarter, Charlotte would have appeared to be in control.
The Hornets scored 36 points and held Philadelphia to 25.
After two quarters, however, the gap had narrowed.
After three quarters, Charlotte still had a competitive position, but the fourth quarter changed everything.
Philadelphia scored 26 points in the final period.
Charlotte scored 17.
The nine-point difference in the fourth quarter was larger than the final margin of victory.
That means Philadelphia effectively created its winning margin in the closing period.
For game analysis, this is important because final statistics can sometimes hide when the decisive separation occurred. In this case, the quarter-by-quarter data makes the turning point very clear.
Defensive statistics and their importance
Philadelphia recorded 7 steals and 5 blocks.
Charlotte recorded 4 steals and 1 block.
While steals and blocks should not be treated as complete measures of defensive quality, the difference demonstrates that Philadelphia produced more visible defensive disruptions.
The 76ers also held Charlotte to 17 points in the fourth quarter.
That combination of late scoring and defensive resistance explains much of the comeback.
Charlotte scored at least 28 points in each of the first three quarters.
Then the offense fell to 17 points in the fourth.
Philadelphia’s defense therefore became particularly important when the game was decided.
Why the final four-point margin matters
A 118-114 final score indicates a competitive contest.
Philadelphia did not dominate the entire game.
Charlotte led early and controlled the rebounding battle. Both teams had nearly identical turnover totals and similar assist numbers.
The decisive differences were shooting efficiency, long-range accuracy, and fourth-quarter execution.
The four-point margin also means Charlotte’s performance should not be dismissed despite the loss. The Hornets generated enough opportunities to stay close and received a 29-point performance from Miller.
Philadelphia simply converted its opportunities more effectively when it mattered most.
What readers should look for in similar NBA box scores
This matchup provides a useful framework for analyzing future games.
When reviewing player statistics, start with the obvious numbers such as points, rebounds, and assists. Then move beyond them.
Look at:
- Field-goal percentage
- Three-point percentage
- Three-point attempts
- Free-throw attempts
- Team rebounds
- Turnovers
- Assists
- Steals
- Blocks
- Quarter scoring
- Scoring distribution among key players
This approach prevents one statistic from dominating the analysis.
For example, Charlotte’s 53 rebounds look impressive on their own. But when placed next to a 38 percent field-goal percentage and 31 percent three-point percentage, the overall offensive picture becomes clearer.
Likewise, Philadelphia’s 118 points become more meaningful when viewed alongside its 49 percent field-goal shooting and 47 percent three-point shooting.
Frequently Asked Questions
Who led the 76ers in scoring against the Hornets?
Joel Embiid led Philadelphia with 29 points. Paul George and Tyrese Maxey each scored 26 points.
Who led the Hornets in scoring?
Brandon Miller led Charlotte with 29 points. LaMelo Ball scored 20 points, while Coby White added 16.
Who had the most rebounds in the game?
Paul George led Philadelphia with 13 rebounds. Moussa Diabate and Kon Knueppel each recorded 11 rebounds for Charlotte.
How many assists did Tyrese Maxey and LaMelo Ball have?
Both players recorded 8 assists. Maxey scored 26 points, while Ball scored 20.
What was the final score between Philadelphia and Charlotte?
Philadelphia defeated Charlotte 118-114 at Spectrum Center in Charlotte on March 29, 2026.
Which team shot better?
Philadelphia shot better from the field and from three-point range. The 76ers shot 49 percent from the field and 47 percent from three, while Charlotte shot 38 percent from the field and 31 percent from three.
Conclusion
The March 29, 2026 matchup between Philadelphia and Charlotte was a strong example of how several different statistical factors can interact in a close NBA game.
Philadelphia won 118-114 despite being outrebounded 53-41. The 76ers overcame that disadvantage through superior shooting efficiency, particularly from three-point range. They shot 49 percent overall and made 16 of 34 three-point attempts.
Joel Embiid’s 29 points led Philadelphia, while Paul George added 26 points and 13 rebounds. Tyrese Maxey also scored 26 points and produced 8 assists.
Charlotte received an equally strong 29-point performance from Brandon Miller. LaMelo Ball added 20 points and 8 assists, while Moussa Diabate and Kon Knueppel each collected 11 rebounds.
The quarter-by-quarter numbers explain the result particularly well. Charlotte started strongly with a 36-25 first quarter, but Philadelphia responded with a 39-point second period. The third quarter was tied at 28 points apiece before Philadelphia closed the game with a 26-17 fourth-quarter advantage.
Ultimately, the 76ers vs charlotte hornets match player stats show that shooting efficiency and late-game execution outweighed Charlotte’s advantage on the boards. The teams were tied in turnovers at nine each, remained close in assists, and both had multiple productive individual performers. Philadelphia’s ability to convert its opportunities more efficiently was the statistical difference that mattered most.
The season series also finished in Philadelphia’s favor at 2-1, adding broader context to the individual game result.